Troubleshooting on Windows
Table of contents:
- System configuration
- Troubleshooting techniques
- Working with Time Travel Debugging traces
- Debugging exceptions and errors
- Configuring automatic memory dumps for erronous process terminations
- Creating a memory dump for an exception
- Reading the exception record
- Find Windows Runtime Error message
- Find the C++ exception object in the SEH exception record
- Read the Last Windows Error value
- Scanning the stack for native exception records
- Finding exception handlers
- Breaking on a specific exception event
- Breaking on a specific Windows Error
- Breaking on a function return
- Decoding error numbers
- Debugging dead-locks and hangs
- Diagnosing waits or high CPU usage
- Diagnosing issues with DLL loading
- Diagnosing window functions (user32)
- Debugging system services (local remote debugging)
- Troubleshooting network connectivity
- Debugging the system kernel
- Tools usage tips
- WinDbg
- Getting information about the debugging session
- Symbols and modules
- General memory commands
- Examining the stack
- Variables
- Strings
- Fixed size arrays
- System objects in the debugger
- Controlling process execution
- Scripting the debugger
- Converting a memory dump from one format to another
- Loading an arbitrary DLL into WinDbg for analysis
- Keyboard and mouse shortcuts
- Running a WinDbg command for all the processes
- Attaching to multiple processes at once
- Injecting a DLL into a process being debugged
- Save and reopen formatted WinDbg output
- Windows Performance Recorder (WPR)
- Windows Performance Analyzer (WPA)
- Perfview
- logman
- wevtutil
- tracerpt
- xperf
- TSS (TroubleShootingScript toolset)
- MSO scripts (PowerShell)
- Performance Counters
- WinDbg
System configuration
Configuring debug symbols
Staring at raw hex numbers is not very helpful for troubleshooting. Therefore, it’s essential to take the time to properly configure debug symbols on our system. One effective method is to set the _NT_SYMBOL_PATH environment variable. Most troubleshooting tools read its value and utilize the specified symbol stores. I usually configure it to point only to the official Microsoft symbol server, resulting in the following value for the _NT_SYMBOL_PATH variable on my system: SRV*C:\symbols\dbg*https://msdl.microsoft.com/download/symbols. Here, C:\symbols serves as a cache folder for storing downloaded symbols. I also use C:\symbols\dbg if I need to index PDB files for my applications. For further information about the _NT_SYMBOL_PATH variable, refer to the official documentation.
The symbol path variable is one essential component required for successful symbol resolution. Another critical aspect is the version of dbghelp.dll that can work with symbol servers. Unfortunately, the version preinstalled with Windows lacks this feature. To overcome this issue, you can install the Debugging Tools for Windows from the Windows SDK. Make sure to install both the x86 and x64 versions to enable debugging of both 32- and 64-bit applications. Once installed, certain tools (e.g., Symbol Informer) will automatically select the appropriate dbghelp.dll version, while others will require some configuration, as we’ll explore in later sections.
Replacing Task Manager with System Informer
My long time favorite tool to observe system and processes running on it, is System Informer, formerly known as Process Hacker. It has so many great features that deserves a guide on its own. The process tree, which shows the process creation and termination events, is much more readable than the flat process list in Task Manager or Resource Monitor. Moreover, System Informer lets you manage services and drivers, and view live network connections. Therefore, I highly recommend to open the Options dialog and replace Task Manager with it. System Informer does not have an option to set the dbghelp.dll path in its settings, but it will detect it if you have Debugging Tools for Windows installed. So please install them to have Windows stacks correctly resolved.
If you have reasons not to use System Informer, you can try Process Explorer. It does not have as many functionalities as System Informer, but it is still a powerful system monitor.
Installing and configuring Sysinternals Suite
Sysinternals tools help me diagnose and fix various issues on Windows systems. Most often I use Process Monitor to capture and analyze system events, and sometimes that’s the only tool I need to solve the problem! Other Sysinternals tools that I frequently use are DebugView, ProcDump, and LiveKd. You can get the entire suite or individual tools from the SysInternals website or from live.sysinternals.com. However, these methods require manual updates when new versions are available. A more convenient way to keep the tools up to date is to install them from Microsoft Store.
To get the most out of Process Monitor and Process Explorer, you need to set up symbol resolution correctly. The default settings do not use the Microsoft symbol store, so you need to adjust them in the options or import the registry keys shown below (after installing Debugging Tools for Windows):
[HKEY_CURRENT_USER\Software\Sysinternals\Process Explorer]
"DbgHelpPath"="C:\\Program Files (x86)\\Windows Kits\\10\\Debuggers\\x64\\dbghelp.dll"
"SymbolPath"="SRV*C:\\symbols\\dbg*http://msdl.microsoft.com/download/symbols"

[HKEY_CURRENT_USER\Software\Sysinternals\Process Monitor]
"DbgHelpPath"="C:\\Program Files (x86)\\Windows Kits\\10\\Debuggers\\x64\\dbghelp.dll"
"SymbolPath"="SRV*C:\\symbols\\dbg*http://msdl.microsoft.com/download/symbols"
Installing WinDbg
There are two versions of WinDbg available nowadays. The modern one, called WinDbgX or WinDbg Preview, and the old one. The modern WinDbg has many interesting features (support for Time-Travel debugging is one of them), so that’s the version you probably want to use if you’re on a supported system.
WinDbgX (WinDbgNext, formely WinDbg Preview)
On modern systems download the appinstaller file and choose Install in the context menu. If you are on Windows Server 2019 and you don’t see the Install option in the context menu, there is a big chance you’re missing the App Installer package on your system. In that case, you may download and run this PowerShell script (created by @Izybkr with my minor updates to make it work with latest WinDbg releases).
Classic WinDbg
If you need to debug on an old system with no support for WinDbgX, you need to download Windows SDK and install the Debugging Tools for Windows feature. Executables will be in the Debuggers folder, for example, c:\Program Files (x86)\Windows Kits\10\Debuggers.
Extensions
Some problems may require actions that are challenging to achieve using the default WinDbg commands. One solution is to create a debugger script using the legacy scripting language, the dx command, or the JavaScript Debugger. Another option is to search for an extension that may already have the desired feature implemented. Here’s a list of extensions I use daily when troubleshooting user-mode issues:
- PDE by Andrew Richards - contains lots of useful commands (run
!pde.helpto learn more) - lldext - contains my utility commands and scripts
- comon - contains commands to help debug COM services
- MEX - another extension with many helper commands (run
!mex.helpto list them) - dotnet-sos - to debug .NET applications
Additionally, you may also check the following repositories containing WinDbg scripts for various problems:
- TimMisiak/WinDbgCookbook
- hugsy/windbg_js_scripts
- 0vercl0k/windbg-scripts
- yardenshafir/WinDbg_Scripts
When we use the .load or .scriptload commands, WinDbg will search for extensions in the following folders:
{install_folder}\{target_arch}\winxp{install_folder}\{target_arch}\winext{install_folder}\{target_arch}\winext\arcade{install_folder}\{target_arch}\pri{install_folder}\{target_arch}%LOCALAPPDATA%\DBG\EngineExtensions32or%LOCALAPPDATA%\DBG\EngineExtensions(only WinDbgX)%PATH%
where target_arch is either x86 or amd64.
I usually include the directories containing the JavaScript scripts in the PATH since they are architecture-agnostic. As for the 32- and 64-bit DLLs, I store them in EngineExtensions32 and EngineExtensions folders, respectively.
It is also possible to configure extensions galleries. Unfortunately, I didn’t manage to make it work with my own extensions.
Installing Time Travel Debugging (TTD) toolkit
The collector is installed with WinDbgX and we may enable it when starting a WinDbgX debugging session.
Alternatively, we could install the command-line TTD collector. The PowerShell script published on the linked site is capable of installing TTD even on systems not supporting the MSIX installations. The command-line tool is probably the best option when collecting TTD traces on server systems. When done, you may uninstall the driver by using the -cleanup option.
Configuring Event Tracing for Windows (ETW)
When loading symbols, the ETW tools and libraries use the _NT_SYMBOLS_PATH environment variable to download (and cache) the PDB files and _NT_SYMCACHE_PATH to store their preprocessed (cached) versions. An example machine configuration might look as follows:
setx /M _NT_SYMBOL_PATH "SRV*C:\symbols\dbg*https://msdl.microsoft.com/download/symbols"
setx /M _NT_SYMCACHE_PATH "C:\symcache"
On Windows 7 64-bit, to improve stack walking, disable paging of the drivers and kernel-mode system code:
reg add "HKLM\System\CurrentControlSet\Control\Session Manager\Memory Management" -v DisablePagingExecutive -d 0x1 -t REG\_DWORD -f
# or
wpr.exe -disablepagingexecutive`
For manifest-based providers set MatchAnyKeywords to 0x00 to receive all events. Otherwise you need to create a bitmask which will be or-ed with event keywords. Additionally when MatchAllKeywords is set, its value is used for events that passed the MatchAnyKeywords test and providers additional and filtering.
For classic providers set MatchAnyKeywords to 0xFFFFFFFF to receive all events.
Up to 8 sessions may collect manifest-based provider events, but only 1 session may be created for a classic provider (when a new session is created the provider switches to the session).
When creating a session we may also specify the minimal severity level for collected events, where 1 is the critical level and 5 the verbose level (all events are logged).
Troubleshooting techniques
Working with Time Travel Debugging traces
Collecting TTD traces
If you have WinDbgX, you may use TTD by checking the “Record with Time Travel Debugging” checkbox when you start a new process or attach to a running one. When you stop the TTD trace in WinDbgX it will terminate the target process (TTD.exe, described later, can detach from a process without killing it).
An alternative to WinDbgX is running the command-line TTD collector. Some usage examples:
# launch a new winver.exe process and record the trace in C:\logs
ttd.exe -accepteula -out c:\logs winver.exe

# attach and trace the process with ID 1234 and all its newly started children
ttd.exe -accepteula -children -out c:\logs -attach 1234

# attach and trace the process with ID 1234 to a ring buffer, backed by a trace file of maximum size 1024 MB
ttd.exe -accepteula -ring -maxFile 1024 -out c:\logs -attach 1234

# record a trace of the running and newly started processes, add a timestamp to the trace file names
ttd.exe -accepteula -timestampFilename -out c:\logs -monitor winver.exe
ttd.exe -accepteula -timestampFilename -out c:\logs -monitor app1.exe -monitor app2.exe
Accessing TTD objects
We can acess TTD objects by querying the TTD property of the session or process objects:
dx -v @$cursession.TTD
# @$cursession.TTD
#     HeapLookup       [Returns a vector of heap blocks that contain the provided address: TTD.Utility.HeapLookup(address)]
#     Calls            [Returns call information from the trace for the specified set of methods: TTD.Calls("module!method1", "module!method2", ...) For example: dx @$cursession.TTD.Calls("user32!SendMessageA")]
#     Memory           [Returns memory access information for specified address range: TTD.Memory(startAddress, endAddress [, "rwec"])]
#     MemoryForPositionRange [Returns memory access information for specified address range and position range: TTD.MemoryForPositionRange(startAddress, endAddress [, "rwec"], minPosition, maxPosition)]
#     PinObjectPosition [Pins an object to the given time position: TTD.PinObjectPosition(obj, pos)]
#     AsyncQueryEnabled : false
#     Data             : Normalized data sources based on the contents of the time travel trace
#     Utility          : Methods that can be useful when analyzing time travel traces
#     ToDisplayString  [ToDisplayString([FormatSpecifier]) - Method which converts the object to its display string representation according to an optional format specifier]

dx -v @$curprocess.TTD
# @$curprocess.TTD
#     Index
#     Threads
#     Events
#     DebugOutput
#     Lifetime         : [66:0, 118A2:0]
#     DefaultMemoryPolicy : GloballyAggressive
#     SetPosition      [Sets the debugger to point to the given position on this process.]
#     GatherMemoryUse  [0]
#     RecordClients
Managing the position in a TTD trace
The TTD Position object describes a moment in time in the trace. Its SeekTo method allows us to jump to this moment and analyze the process state:
dx -r1 @$create("Debugger.Models.TTD.Position", 34395, 1278)
# @$create("Debugger.Models.TTD.Position", 34395, 1278)                 : 865B:4FE [Time Travel]
#     Sequence         : 0x865b
#     Steps            : 0x4fe
#     SeekTo           [Method which seeks to time position]
#     ToSystemTime     [Method which obtains the approximate system time at a given position]

dx -s @$create("Debugger.Models.TTD.Position", 34395, 1278).SeekTo()
# (1d30.1b94): Break instruction exception - code 80000003 (first/second chance not available)
# Time Travel Position: 865B:4FE
Alternatively, we could use !tt 865B:4FE to jump to a specific time position.
If we are troubleshooting an issue spanning multiple processes, we may simultaneously record TTD traces for all of them, and later, use the TTD Position objects to set the same moment in time in all the traces. It is a very effective technique when debugging locking issues.
Querying debugging events
The @$curprocess.Events collection contains TTD Event objects. We can use the group query to learn what type of events we have in our trace:
dx -g @$curprocess.TTD.Events.GroupBy(ev => ev.Type).Select(g => new { Type = g.First().Type, Count = g.Count() })
# ===========================================================
# =                         = (+) Type            = Count   =
# ===========================================================
# = ["ModuleLoaded"]        - ModuleLoaded        - 0x23    =
# = ["ThreadCreated"]       - ThreadCreated       - 0x9     =
# = ["ThreadTerminated"]    - ThreadTerminated    - 0x9     =
# = ["Exception"]           - Exception           - 0x4     =
# = ["ModuleUnloaded"]      - ModuleUnloaded      - 0x23    =
# ===========================================================
Next, we may filter the list for events that interest us, for example, to extract the first TTD Exception object, we may run the following query:
dx @$curprocess.TTD.Events.Where(ev => ev.Type == "Exception").Select(ev => ev.Exception).First()
# @$curprocess.TTD.Events.Where(ev => ev.Type == "Exception").Select(ev => ev.Exception).First()                 : Exception 0xE0434352 of type Software at PC: 0X7FF91E0842D0
#     Position         : 7E7C:0 [Time Travel]
#     Type             : Software
#     ProgramCounter   : 0x7ff91e0842d0
#     Code             : 0xe0434352
#     Flags            : 0x1
#     RecordAddress    : 0x0
# ...
Examining function calls
The Calls method of the TTD objects allows us to query function calls made in the trace. We may use either an address or a symbol name (even with wildcards) as a parameter to the Calls method:
x OLEAUT32!IDispatch_Invoke_Proxy
# 75a13bf0          OLEAUT32!IDispatch_Invoke_Proxy (void)

# we may use the address of a function
dx @$cursession.TTD.Calls(0x75a13bf0).Count()
# @$cursession.TTD.Calls(0x75a13bf0).Count() : 0x6a18

# or its symbolic name
dx @$cursession.TTD.Calls("OLEAUT32!IDispatch_Invoke_Proxy").Count()
# @$cursession.TTD.Calls("OLEAUT32!IDispatch_Invoke_Proxy").Count() : 0x6a18
Thanks to wildcards, we can easily get statistics on function calls from a given module or modules (this call might take some time for longer traces):
# Show the number of calls made to functions with names starting from NdrClient in the rpcrt4 module
dx -g @$cursession.TTD.Calls("rpcrt4!NdrClient*").GroupBy(c => c.Function).Select(g => new { Function = g.First().Function, Count = g.Count() })
# ==============================================================================
# =                                   = (+) Function                  = Count  =
# ==============================================================================
# = ["RPCRT4!NdrClientCall2"]         - RPCRT4!NdrClientCall2         - 0x5    =
# = ["RPCRT4!NdrClientInitialize"]    - RPCRT4!NdrClientInitialize    - 0x5    =
# = ["RPCRT4!NdrClientCall3"]         - RPCRT4!NdrClientCall3         - 0x8    =
# = ["RPCRT4!NdrClientZeroOut"]       - RPCRT4!NdrClientZeroOut       - 0x1    =
# ==============================================================================
TimeStart shows the position of a call in a trace and we may use it to jump between different places in the trace. SystemTimeStart shows the clock time of a given call:
dx -g @$cursession.TTD.Calls("user32!DialogBox*").Select(c => new { Function = c.Function, TimeStart = c.TimeStart, SystemTimeStart = c.SystemTimeStart })
# ==============================================================================================================
# =          = (+) Function                         = (+) TimeStart = (+) SystemTimeStart                      =
# ==============================================================================================================
# = [0x0]    - USER32!DialogBoxIndirectParamW       - 62E569:57     - Friday, February 2, 2024 16:03:39.391    =
# = [0x1]    - USER32!DialogBoxIndirectParamAorW    - 62E569:5C     - Friday, February 2, 2024 16:03:39.391    =
# = [0x2]    - USER32!DialogBox2                    - 631C23:102    - Friday, February 2, 2024 16:03:39.791    =
Each function call has a Parameters property that gives us access to the function parameters (without private symbols, we can access the first four parameters) of a call:
# Check which LastErrors were set during the call
dx -h @$cursession.TTD.Calls("ntdll!RtlSetLastWin32Error").Select(c => c.Parameters[0]).Distinct()
# @$cursession.TTD.Calls("ntdll!RtlSetLastWin32Error").Select(c => c.Parameters[0]).Distinct()
#     [0x0]            : 0xbb
#     [0x1]            : 0x57
#     [0x2]            : 0x0
#     [0x3]            : 0x7e
#     [0x4]            : 0x3f0

# Find LastError calls when LastError is not zero
dx -g @$cursession.TTD.Calls("ntdll!RtlSetLastWin32Error").Where(c => c.Parameters[0] != 0).Select(c => new { TimeStart = c.TimeStart, Error = c.Parameters[0] })
# =========================================
# =           = (+) TimeStart = Error     =
# =========================================
# = [0x0]     - 725:3B        - 0xbb      =
# = [0x1]     - 725:3D6       - 0x57      =
# = [0x2]     - 725:4AA       - 0x57      =
# = [0x3]     - 725:EF0       - 0xbb      =
# ....
Examining memory access
The Memory and MemoryForPositionRange methods of the TTD Session object return TTD Memory objects describing various operations on the memory. For example, the command below shows all the changes to the global GcInProgress variable in a .NET application:
dx -g @$cursession.TTD.Memory(&coreclr!g_pGCHeap->GcInProgress, &coreclr!g_pGCHeap->GcInProgress+4, "w")
# ==============================================================================================================================================================================================================================================================================================================
# =          = (+) EventType = (+) ThreadId = (+) UniqueThreadId = (+) TimeStart = (+) TimeEnd = (+) AccessType = (+) IP            = (+) Address       = (+) Size = (+) Value        = (+) OverwrittenValue = (+) SystemTimeStart                            = (+) SystemTimeEnd                              =
# ==============================================================================================================================================================================================================================================================================================================
# = [0x0]    - 0x1           - 0x2c80       - 0x2                - C79:58C       - C79:58C     - Write          - 0x7ff8fdbce0ee    - 0x7ff8fe00caf0    - 0x8      - 0x2b4800c9bc0    - 0x0                  - poniedziałek, 15 kwietnia 2024 10:14:18.475    - poniedziałek, 15 kwietnia 2024 10:14:18.475    =
# = [0x1]    - 0x1           - 0x2c80       - 0x2                - 3AF4:5A       - 3AF4:5A     - Write          - 0x7ff8fdcdacc3    - 0x7ff8fe00cae8    - 0x4      - 0x1              - 0x0                  - poniedziałek, 15 kwietnia 2024 10:14:20.896    - poniedziałek, 15 kwietnia 2024 10:14:20.896    =
# = [0x2]    - 0x1           - 0x2c80       - 0x2                - 3B26:E6C      - 3B26:E6C    - Write          - 0x7ff8fdcdacc3    - 0x7ff8fe00cae8    - 0x4      - 0x0              - 0x1                  - poniedziałek, 15 kwietnia 2024 10:14:20.910    - poniedziałek, 15 kwietnia 2024 10:14:20.910    =
# = [0x3]    - 0x1           - 0x2c80       - 0x2                - 87DF:5A       - 87DF:5A     - Write          - 0x7ff8fdcdacc3    - 0x7ff8fe00cae8    - 0x4      - 0x1              - 0x0                  - poniedziałek, 15 kwietnia 2024 10:14:24.539    - poniedziałek, 15 kwietnia 2024 10:14:24.539    =
# = [0x4]    - 0x1           - 0x2c80       - 0x2                - 880C:50C      - 880C:50C    - Write          - 0x7ff8fdcdacc3    - 0x7ff8fe00cae8    - 0x4      - 0x0              - 0x1                  - poniedziałek, 15 kwietnia 2024 10:14:24.548    - poniedziałek, 15 kwietnia 2024 10:14:24.548    =
# = [0x5]    - 0x1           - 0x2c80       - 0x2                - 889F:5A       - 889F:5A     - Write          - 0x7ff8fdcdacc3    - 0x7ff8fe00cae8    - 0x4      - 0x1              - 0x0                  - poniedziałek, 15 kwietnia 2024 10:14:25.769    - poniedziałek, 15 kwietnia 2024 10:14:25.769    =
# ==============================================================================================================================================================================================================================================================================================================
The MemoryForPositionRange method allows us to additionally limit memory access queries to a specific time-range. It makes sense to use this method for scope-based addresses, such as function parameters or local variables. Below, you may see an example of a query when we list all the places in the CreateFileW function that read the file name (the first argument to the function):
dx -s @$call = @$cursession.TTD.Calls("kernelbase!CreateFileW").First()
dx -g @$cursession.TTD.MemoryForPositionRange(@$call.Parameters[0], @$call.Parameters[0] + sizeof(wchar_t), "r", @$call.TimeStart, @$call.TimeEnd)
# ======================================================================================================================================================
# =          = (+) Position = ThreadId  = UniqueThreadId = Address          = IP                = Size   = AccessType = Value               = (+) Data =
# ======================================================================================================================================================
# = [0x0]    - AB:1981      - 0x2018    - 0x2            - 0x236011c33c0    - 0x7ff91e04a836    - 0x2    - Read       - 0x55005c003a0043    - {...}    =
# = [0x1]    - AB:1AD4      - 0x2018    - 0x2            - 0x236011c33c0    - 0x7ff91e04b6e1    - 0x2    - Read       - 0x55005c003a0043    - {...}    =
# = [0x2]    - AB:1C27      - 0x2018    - 0x2            - 0x236011c33c0    - 0x7ff91e04b796    - 0x2    - Read       - 0x55005c003a0043    - {...}    =
# = [0x3]    - AB:1C5E      - 0x2018    - 0x2            - 0x236011c33c0    - 0x7ff91e04bca9    - 0x2    - Read       - 0x55005c003a0043    - {...}    =
# = [0x4]    - AB:1CC8      - 0x2018    - 0x2            - 0x236011c33c0    - 0x7ff91e04caa8    - 0x2    - Read       - 0x55005c003a0043    - {...}    =
# = [0x5]    - AB:1CCA      - 0x2018    - 0x2            - 0x236011c33c0    - 0x7ff91e04caae    - 0x2    - Read       - 0x55005c003a0043    - {...}    =
# = [0x6]    - AB:1CCF      - 0x2018    - 0x2            - 0x236011c33c0    - 0x7ff91e04cabe    - 0x2    - Read       - 0x55005c003a0043    - {...}    =
# = [0x7]    - AB:1E23      - 0x2018    - 0x2            - 0x236011c33c0    - 0x7ff91e04bd5a    - 0x2    - Read       - 0x55005c003a0043    - {...}    =
# = [0x8]    - AB:1E2A      - 0x2018    - 0x2            - 0x236011c33c0    - 0x7ff91e04bd7b    - 0x2    - Read       - 0x55005c003a0043    - {...}    =
# = [0x9]    - AB:1E5C      - 0x2018    - 0x2            - 0x236011c33c0    - 0x7ff91e04be56    - 0x2    - Read       - 0x55005c003a0043    - {...}    =
# = [0xa]    - AB:1E68      - 0x2018    - 0x2            - 0x236011c33c0    - 0x7ff91e04be7a    - 0x2    - Read       - 0x55005c003a0043    - {...}    =
# ======================================================================================================================================================
Debugging exceptions and errors
Configuring automatic memory dumps for erronous process terminations
We all experience application failures from time to time. When it happens, Windows collectes some data about a crash and saves it to the event log. It usually lacks details required to fully understand the root cause of an issue. Fortunately, we have options to replace this scarse report with, for example, a memory dump. One way to accomplish that is by configuring Windows Error Reporting. By default WER takes dumps only when necessary, but this behavior can be configured and we can force WER to always create a dump by modifying HKLM\Software\Microsoft\Windows\Windows Error Reporting\ForceQueue=1 or (HKEY_CURRENT_USER\Software\Microsoft\Windows\Windows Error Reporting\ForceQueue=1). The reports are usually saved at %LocalAppData%\Microsoft\Windows\WER, in two directories: ReportArchive, when a server is available or ReportQueue, when the server is unavailable. If you want to keep the data locally, just set the server to a non-existing machine (for example, HKEY_LOCAL_MACHINE\SOFTWARE\Microsoft\Windows\Windows Error Reporting\CorporateWERServer=NonExistingServer). For system processes you need to look at C:\ProgramData\Microsoft\Windows\WER. In Windows 2003 Server R2 Error Reporting stores errors in the signed-in user’s directory (for example, C:\Documents and Settings\me\Local Settings\Application Data\PCHealth\ErrorRep).
Starting with Windows Server 2008 and Windows Vista with Service Pack 1 (SP1), Windows Error Reporting can be configured to collect full memory dumps on application crash. The registry key enabling this behavior is HKEY_LOCAL_MACHINE\Software\Microsoft\Windows\Windows Error Reporting\LocalDumps. An example configuration for saving full-memory dumps to the %SYSTEMDRIVE%\dumps folder when the test.exe application fails looks as follows:
Windows Registry Editor Version 5.00

[HKEY_LOCAL_MACHINE\SOFTWARE\Microsoft\Windows\Windows Error Reporting\LocalDumps]

[HKEY_LOCAL_MACHINE\SOFTWARE\Microsoft\Windows\Windows Error Reporting\LocalDumps\test.exe]
"DumpFolder"=hex(2):25,00,53,00,59,00,53,00,54,00,45,00,4d,00,44,00,52,00,49,\
  00,56,00,45,00,25,00,5c,00,64,00,75,00,6d,00,70,00,73,00,00,00
"DumpType"=dword:00000002
With the help of the WER API, you may also force WER reports in your custom application or even register a custom crash handler.
To completely disable WER, create a DWORD Value under the HKEY_LOCAL_MACHINE\SOFTWARE\Microsoft\Windows\Windows Error Reporting key, named Disabled and set its value to 1. For 32-bit apps use the HKEY_LOCAL_MACHINE\SOFTWARE\Wow6432Node\Microsoft\Windows\Windows Error Reporting key.
There is also a special AeDebug key in the registry defining what should happen when an unhandled exception occurs in an application. You may find it under the HKEY_LOCAL_MACHINE\SOFTWARE\Microsoft\Windows NT\CurrentVersion key (or HKEY_LOCAL_MACHINE\SOFTWARE\WOW6432Node\Microsoft\Windows NT\CurrentVersion for 32-bit apps). Its important value keys include:
Debugger: REG_SZ - application which will be called to handle the problematic process (example value:procdump.exe -accepteula -j "c:\dumps" %ld %ld %p), the first%ldparameter is replaced with the process ID and the second with the event handleAuto:REG_SZ- defines if the debugger runs automatically, without prompting the user (example value:1)UserDebuggerHotKey:REG_DWORD- not sure, but it looks it enables the Debug button on the exception handling message box (example value:1)
My favourite tool to use as the automatic debugger is ProcDump as an automatic debugger with the following command (-u to uninstall):
# create minidumps and save them under the C:\Dumps folder
procdump -mp -i C:\Dumps
These dumps can take up a lot of disk space over time, so you should either delete the old files periodically, or set up a task scheduler job that does it for you.
To set WinDbg as the AeDebug debugger, run windbg -I. However, we may also configure the AeDebug keys manually, for example:
Debugger = "C:\Users\me\AppData\Local\Microsoft\WindowsApps\WinDbgX.exe" -c ".dump /ma /u C:\dumps\crash.dmp; qd" -p %ld -e %ld -g
Auto = 1
If you miss the -g option, WinDbg will inject a remote thread with a breakpoint instruction, which will hide our original exception. In such case, you might need to scan the stack to find the original exception record.
Creating a memory dump for an exception
It is often a good way to start diagnosing errors by observing 1st chance exceptions occurring in a process. At this point we don’t want to collect any dumps, only logs. We may achieve this by specyfing a non-existing exception name in the filter command, for example:
C:\Utils> procdump -e 1 -f "DoesNotExist" 8012
...

CLR Version: v4.0.30319

[09:03:27] Exception: E0434F4D.System.NullReferenceException ("Object reference not set to an instance of an object.")
[09:03:28] Exception: E0434F4D.System.NullReferenceException ("Object reference not set to an instance of an object.")
We may also observe the logs in procmon. In order to see the procdump log events in procmon remember to add procdump.exe and procdump64.exe to the accepted process names in procmon filters.
To create a full memory dump when NullReferenceException occurs use the following command:
procdump -ma -e 1 -f "E0434F4D.System.NullReferenceException" 8012
From some time procdump uses a managed debugger engine when attaching to .NET Framework processes. This is great because we can filter exceptions based on their managed names. Unfortunately, that works only for 1st chance exceptions (at least for .NET 4.0). 2nd chance exceptions are raised out of the .NET Framework and must be handled by a native debugger. Starting from .NET 4.0 it is no longer possible to attach both managed and native engine to the same process. Thus, if we want to make a dump on the 2nd chance exception for a .NET application, we need to use the -g option in order to force procdump to use the native engine.
Reading the exception record
The .ecxr debugger command instructs the debugger to restore the thread context to its state when the initial fault happened. When dispatching a SEH exception, the OS builds an internal structure called an exception record. It also conveniently saves the thread context at the time of the initial fault in a context record structure.
typedef struct _EXCEPTION_RECORD {
  DWORD                    ExceptionCode;
  DWORD                    ExceptionFlags;
  struct _EXCEPTION_RECORD *ExceptionRecord;
  PVOID                    ExceptionAddress;
  DWORD                    NumberParameters;
  ULONG_PTR                ExceptionInformation[EXCEPTION_MAXIMUM_PARAMETERS];
} EXCEPTION_RECORD;
.lastevent will also show you information about the last error that occured (if the debugger stopped because of an error). You may then examine the exception record using the .exr command, for example:
.lastevent
# Last event: 15ae8.133b4: CLR exception - code e0434f4d (first/second chance not available)
#   debugger time: Thu Jul 30 19:23:53.169 2015 (UTC + 2:00)

.exr -1
# ExceptionAddress: 000007fe9b17f963
#    ExceptionCode: e0434f4d (CLR exception)
#   ExceptionFlags: 00000000
# NumberParameters: 0
If we look at the raw memory, we will find that .exr changes the order of the EXCEPTION_RECORD fields, for example:
.exr 0430af24
# ExceptionAddress: abe8f04d
#    ExceptionCode: c0000005 (Access violation)
#   ExceptionFlags: 00000000
# NumberParameters: 2
#    Parameter[0]: 00000000
#    Parameter[1]: abe8f04d
0430af24  c0000005 <- exception code
0430af28  00000000
0430af2c  00000000
0430af30  abe8f04d <- exception address (code address)
0430af34  00000002 <- parameters number
0430af38  00000000
0430af3c  abe8f04d
Find Windows Runtime Error message
If you need to diagnose Windows Runtime Error for example: (2f88.3358): Windows Runtime Originate Error - code 40080201 (first chance), you may enable first chance notification for this error: sxe 40080201. When stopped, retrieve the exception context, and the third parameter should contain an error message:
.exr -1
# ExceptionAddress: 77942822 (KERNELBASE!RaiseException+0x00000062)
#    ExceptionCode: 40080201 (Windows Runtime Originate Error)
#   ExceptionFlags: 00000000
# NumberParameters: 3
#    Parameter[0]: 80040155
#    Parameter[1]: 00000052
#    Parameter[2]: 0dddf680

du 0dddf680
# 0dddf680  "Failed to find proxy registratio"
# 0dddf6c0  "n for IID: {xxxxxxxx-xxxx-xxxx-x"
# 0dddf700  "xxx-xxxxxxxxxxxx}."
We may automate this step by using the $exr_param2 pseudo-register:
sxe -c "du @$exr_param2 L40; g" 40080201
Find the C++ exception object in the SEH exception record
(Tested on MSVC140)
If it’s the first chance exception, we can find the exception record at the top of the stack:
dps @esp
# 00f3fb28  7657ec52 KERNELBASE!RaiseException+0x62
# 00f3fb2c  00f3fb30
# 00f3fb30  e06d7363
# 00f3fb34  00000001
# 00f3fb38  00000000
# 00f3fb3c  7657ebf0 KERNELBASE!RaiseException
# 00f3fb40  00000003
# 00f3fb44  19930520
# 00f3fb48  00f3fbd8
# 00f3fb4c  009ab96c exceptions!_TI3?AVinvalid_argumentstd
With dx and the MSVCP140D!EHExceptionRecord symbol (without this symbol, we need to get the value from .exr -1), we may decode the exception record parameters:
dx -r2 (MSVCP140D!EHExceptionRecord*)0x00f3fb30
# (MSVCP140D!EHExceptionRecord*)0x00f3fb30                 : 0xf3fb30 [Type: EHExceptionRecord *]
#     [+0x000] ExceptionCode    : 0xe06d7363 [Type: unsigned long]
#     [+0x004] ExceptionFlags   : 0x1 [Type: unsigned long]
#     [+0x008] ExceptionRecord  : 0x0 [Type: _EXCEPTION_RECORD *]
#     [+0x00c] ExceptionAddress : 0x7657ebf0 [Type: void *]
#     [+0x010] NumberParameters : 0x3 [Type: unsigned long]
#     [+0x014] params           [Type: EHExceptionRecord::EHParameters]
#         [+0x000] magicNumber      : 0x19930520 [Type: unsigned long]
#         [+0x004] pExceptionObject : 0xf3fbd8 [Type: void *]
#         [+0x008] pThrowInfo       : 0x9ab96c [Type: _s_ThrowInfo *]
As you can see, the second parameter points to the C++ exception object. If we know its type, we may dump its properties, for example:
dx (exceptions!std::invalid_argument*)0x00f3fbd8
#   [+0x004] _Data            : __std_exception_data

dx -r1 (*((exceptions!__std_exception_data *)0xf3fbdc))
# (*((exceptions!__std_exception_data *)0xf3fbdc))                 [Type: __std_exception_data]
#     [+0x000] _What            : 0x1449748 : "arg1" [Type: char *]
#     [+0x004] _DoFree          : true [Type: bool]
Read the Last Windows Error value
To get the last error value for the current thread we may use the !gle or !teb command. !gle has an additional -all parameter which shows the last errors for all the threads:
!gle -all
# Last error for thread 0:
# LastErrorValue: (Win32) 0 (0) - The operation completed successfully.
# LastStatusValue: (NTSTATUS) 0xc0000034 - Object Name not found.
#
# Last error for thread 1:
# LastErrorValue: (Win32) 0 (0) - The operation completed successfully.
# LastStatusValue: (NTSTATUS) 0 - STATUS_SUCCESS
Scanning the stack for native exception records
Sometimes, when the memory dump was incorrectly collected, we may not see the exception information and the .exr -1 does not work. When this happens, there is still a chance that the original exception is somewhere in the stack. Using the .foreach command, we may scan the stack and try all the addresses to see if any of them is a valid exception record. For example:
.foreach /ps1 ($addr { dp /c1 @$csp L100 }) { .echo $addr; .exr $addr }
# 0430af24
# ExceptionAddress: abe8f04d
#    ExceptionCode: c0000005 (Access violation)
#   ExceptionFlags: 00000000
# NumberParameters: 2
#    Parameter[0]: 00000000
#    Parameter[1]: abe8f04d
Finding exception handlers
To list exception handlers for the currently running method use !exchain command.
Managed exception handlers can be listed using the !EHInfo command from the SOS extenaion. I present how to use this command to list ASP.NET MVC exception handlers on my blog.
In 32-bit application, pointer to the exception handler is kept in fs:[0]. The prolog for a method with exception handling has the following structure:
mov     eax,fs:[00000000]
push    eax
mov     fs:[00000000],esp
An Example session of retrieving the exception handler:
dd /c1 fs:[0]-8 L10
# 0053:fffffff8  00000000
# 0053:fffffffc  00000000
# 0053:00000000  0072ef74 <-- this is our first exception pointer to a handler
# 0053:00000004  00730000
# 0053:00000008  0072c000

dd /c1 0072ef74-8 L10
# 0072ef6c  0072eefc
# 0072ef70  74275582
# 0072ef74  0072f04c <-- previous handler
# 0072ef78  744048b9 <-- handler address
# 0072ef7c  2778008f
# 0072ef80  00000000
# 0072ef84  0072f058
# 0072ef88  744064f9
In 64-bit applications, information about exception handlers is stored in the PE file. We can list them using, for example, the dumpbin /unwindinfo command.
Breaking on a specific exception event
The sx- commands define how WinDbg handles exception events that happen in the process lifetime. For example, to stop the debugger when a C++ exception is thrown (1st change exception) we would use the sxe eh command. If we only need information that an exception occurred, we could use the sxn eh command. Additionally, the -c parameter gives us a possibility to run our custom command on error:
sxe -c ".lastevent;!pe;!clrstack;g" clr
Breaking on a specific Windows Error
There is a special global variable in ntdll, g_dwLastErrorToBreakOn, that you may set to cause a break whenever a given last error code is set by the application. For example, to break the application execution whenever it reports the 0x4cf (ERROR_NETWORK_UNREACHABLE) error, run:
ed ntdll!g_dwLastErrorToBreakOn 0x4cf
You may find the list of errors in the Windows documentation.
Breaking on a function return
If we want to break when a function finishes, for example, to analyze its result, we may use a nested one-time breakpoint on the function return address, for example:
bp kernelbase!CreateFileW "bp /1 $ra \"r @rax\"; g"
Decoding error numbers
If you receive an error message with a cryptic error number like this, for example: Compiler Error Message: The compiler failed with error code -1073741502, you may use the !error command:
!error c0000142
# Error code: (NTSTATUS) 0xc0000142 (3221225794) - {DLL Initialization Failed} Initialization of the dynamic link library %hs failed. The process is terminating abnormally.
Even more error codes and error messages are contained in the !pde.err command from the PDE extension.
If you need to convert HRESULT to Windows Error, the following pseudo-code might help:
a = hresult & 0x1FF0000
if (a == 0x70000) {
    winerror = hresult & 0xFFFF
} else {
    winerror = hresult
}
Converting Windows Error to HRESULT is straightforward: hresult = 0x80070000 | winerror.
A great command line tool for decoding error number is err.exe or Error Code Look-up. It looks for the specific value in Windows headers, additionally performing the convertion to hex, for example:
err -1073741502
# for decimal -1073741502 / hex 0xc0000142 :
#  STATUS_DLL_INIT_FAILED                                        ntstatus.h
# {DLL Initialization Failed}
# Initialization of the dynamic link library %hs failed. The
# process is terminating abnormally.
# ...
There is also a subcommand in the Windows built-in net command to decode Windows error numbers (and only error numbers), for example:
net helpmsg 2
# The system cannot find the file specified.
Debugging dead-locks and hangs
We usually start the analysis by looking at the threads running in a process. The call stacks help us identify blocked threads. We can use TTD, thread-time trace, or memory dumps to learn about what threads are doing. In the follow-up sections, I will describe how to find lock objects and relations between threads in memory dumps.
Listing threads call stacks
To list native stacks for all the threads run: ~*k or !uniqstacks.
Finding locks in memory dumps
There are many types of objects that the thread can wait on. You usually see WaitOnMultipleObjects on many threads.
If you see RtlWaitForCriticalSection it might indicate that the thread is waiting on a critical section. Its adress should be in the call stack. And we may list the critical sections using the !cs` command. With the -s option, we may examine details of a specific critical section:
!cs -s 000000001a496f50
# -----------------------------------------
# Critical section   = 0x000000001a496f50 (+0x1A496F50)
# DebugInfo          = 0x0000000013c9bee0
# LOCKED
# LockCount          = 0x0
# WaiterWoken        = No
# OwningThread       = 0x0000000000001b04
# RecursionCount     = 0x1
# LockSemaphore      = 0x0
# SpinCount          = 0x00000000020007d0
LockCount tells you how many threads are currently waiting on a given cs. The OwningThread is a thread that owns the cs at the time the command is run. You can easily identify the thread that is waiting on a given cs by issuing kv command and looking for critical section identifier in the call parameters.
We can also look for synchronization object handles using the !handle command. For example, we may list all the Mutant objects in a process by using the !handle 0 f Mutant command.
Diagnosing waits or high CPU usage
There are two ways of tracing CPU time. We could either use CPU sampling or Thread Time profiling. CPU sampling is about collecting samples in intervals: each CPU sample contains an instruction pointer to the currently executing code. Thus, this technique is excellent when diagnosing high CPU usage of an application. It won’t work for analyzing waits in the applications. For such scenarios, we should rely on Thread Time profiling. It uses the system scheduler/dispatcher events to get detailed information about application CPU time. When combined with CPU sampling, it is the best non-invasive profiling solution.
Collecting ETW trace
We may use PerfView or wpr.exe to collect CPU samples and Thread Time events.
When collecting CPU samples, PerfView relies on Profile events coming from the Kernel ETW provider which has very low impact on the system overall performance. An example command to start the CPU sampling:
perfview collect -NoGui -KernelEvents:Profile,ImageLoad,Process,Thread -ClrEvents:JITSymbols cpu-collect.etl
Alternatively, you may use the Collect dialog. Make sure the Cpu Samples checkbox is selected.
To collect Thread Time events, you may use the following command:
perfview collect -NoGui -ThreadTime thread-time-collect.etl
The Collect dialog has also the Thread Time checkbox.
Analysing the collected traces
For analyzing CPU Samples, use the CPU Stacks view. Always check the number of samples if it corresponds to the tracing time (CPU sampling works when we have enough events). If necessary, zoom into the interesting period using a histogram (select the time and press Alt + R). Checking the By Name tab could be enough to find the method responsible for the high CPU Usage (look at the inclusive time and make sure you use correct grouping patterns).
When analyzing waits in an application, we should use the Thread Time Stacks views. The default one, with StartStop activities, tries to group the tasks under activities and helps diagnose application activities, such as HTTP requests or database queries. Remember that the exclusive time in the activities view is a sum of all the child tasks. The thread under the activity is the thread on which the task started, not necessarily the one on which it continued. The with ReadyThread view can help when we are looking for thread interactions. For example, we want to find the thread that released a lock on which a given thread was waiting. The Thread Time Stacks view (with no grouping) is the best one to visualize the application’s sequence of actions. Expanding thread nodes in the CallTree could take lots of time, so make sure you use other events (for example, from the Events view) to set the time ranges. As usual, check the grouping patterns.
Diagnosing issues with DLL loading
An invaluable source of information when dealing with DLL loading issues are Windows Loader snaps. Those are detailed logs of the steps that Windows Loader takes to resolve the application library dependencies. They are one of the available Global Flags that we can set for an executable, so we may use the gflags.exe tool to enable them.

Alternatively, you may modify the process IFEO registry key, for example:
Windows Registry Editor Version 5.00

[HKEY_LOCAL_MACHINE\SOFTWARE\Microsoft\Windows NT\CurrentVersion\Image File Execution Options\winver.exe]
"GlobalFlag"=dword:000000002
Once enabled, you need to start the failing application under a debugger and the Loader logs should appear in the debug output.
Alternatively, you may collect a procmon or ETW trace and search for any failure in the file events.
Diagnosing window functions (user32)
The code snippet below contains example commands creating breakpoints to trace window functions:
# 32-bit
bp user32!NtUserSetWindowPos ".printf \"SetWindowPos( hWnd: %p, hWndInsertAfter: %p, X: %d, Y: %d, cx: %d, cy: %d, uFlags: %x )\\n\", poi(@esp+4), poi(@esp+8), poi(@esp+0xC), poi(@esp+0x10), poi(@esp+0x14), poi(@esp+0x18), poi(@esp+0x1C); g"
bp user32!NtUserShowWindow ".printf \"ShowWindow( hWnd: %p, nCmdShow: %d )\\n\", poi(@esp+4), poi(@esp+8); g"
bp user32!SetWindowLongW ".printf \"SetWindowLongW( hWnd: %p, nIndex: %d, dwNewLong: %p )\\n\", poi(@esp+4), poi(@esp+8), poi(@esp+0xC); g"
bp user32!SetForegroundWindow ".printf \"SetForegroundWindow( hWnd: %p )\\n\", poi(@esp+4); g"
bp user32!NtUserSetParent ".printf \"SetParent( hWndChild: %p, hWndNewParent: %p )\\n\", poi(@esp+4), poi(@esp+8); g"

# 32-bit, but using dx
bp user32!NtUserSetWindowPos "dx new { function = \"SetWindowPos\", hWnd = *(void **)(@esp+4), hWndInsertAfter = *(void **)(@esp+8), X = *(int *)(@esp+0xC), Y = *(int *)(@esp+0x10), cx = *(int *)(@esp+0x14), cy = *(int *)(@esp+0x18), uFlags = *(unsigned int *)(@esp+0x1C) }; g"
bp user32!NtUserSetForegroundWindow "dx new { function = \"SetForegroundWindow\", hWnd = *(void **)(@esp+4) }; g"
bp user32!NtUserShowWindow "dx new { function = \"ShowWindow\", hWnd = *(void **)(@esp+4), nCmdShow = *(int *)(@esp+8) }; g"
bp user32!NtUserSetParent "dx new { function = \"SetParent\", hWndChild = *(void **)(@esp+4), hWndNewParent = *(void **)(@esp+8) }; g"
bp user32!NtUserSetWindowLong "dx new { function = \"SetWindowLongW\", hWnd = *(void **)(@esp+4), nIndex = *(int *)(@esp+8), dwNewLong = *(long *)(@esp+0xC) }; g"

# 64-bit
bp user32!NtUserSetWindowPos ".printf \"SetWindowPos( hWnd: %p, hWndInsertAfter: %p, X: %d, Y: %d, cx: %d, cy: %d, uFlags: %x )\\n\", @rcx, @rdx, @r8, @r9, poi(@rsp+0x20), poi(@rsp+0x28), poi(@rsp+0x30); g"
bp user32!NtUserShowWindow ".printf \"ShowWindow( hWnd: %p, nCmdShow: %d )\\n\", @rcx, @rdx; g"
bp user32!SetWindowLongW ".printf \"SetWindowLongW( hWnd: %p, nIndex: %d, dwNewLong: %p )\\n\", @rcx, @rdx, @r8; g"
bp user32!SetForegroundWindow ".printf \"SetForegroundWindow( hWnd: %p )\\n\", @rcx; g"
bp user32!NtUserSetParent ".printf \"SetParent( hWndChild: %p, hWndNewParent: %p )\\n\", @rcx, @rdx; g"

# 64-bit, but using dx
bp user32!NtUserSetWindowPos "dx new { function = \"SetWindowPos\", hWnd = (void *)@rcx, hWndInsertAfter = (void *)@rdx, X = (int)@r8, Y = (int)@r9, cx = *(int *)(@rsp+0x28), cy = *(int *)(@rsp+0x30), uFlags = *(unsigned int *)(@rsp+0x38) }; g"
bp user32!SetForegroundWindow "dx new { function = \"SetForegroundWindow\", hWnd = (void *)@rcx }; g"
bp user32!NtUserShowWindow "dx new { function = \"ShowWindow\", hWnd = (void *)@rcx, nCmdShow = (int)@rdx }; g"
bp user32!_imp_NtUserSetParent "dx new { function = \"SetParent\", hWndChild = (void *)@rcx, hWndNewParent = (void *)@rdx }; g"
bp user32!SetWindowLongW "dx new { function = \"SetWindowLongW\", hWnd = (void *)@rcx, nIndex = (int)@rdx, dwNewLong = (long)@r8 }; g"

# conditional breakpoints
bp user32!PeekMessageW "r $t1 = poi(@esp+4); bp /1 @$ra \".lastevent; dt (combase!tagMSG)@$t1; g\"; g"
bp user32!PeekMessageW ".lastevent; r $t1 = poi(@esp+4); r $t2 = poi(@esp+8); .printf \"PeekMessageW(%x, %x)\n\", @$t1, @$t2; ba e1 /1 @$ra \".if (poi(@$t1) == 0x40526) { .lastevent; dt (combase!tagMSG)@$t1; g } .else { g }\"; g"
bp user32!PeekMessageW "r $t1 = poi(@esp+4); ba e1 /1 @$ra \".if (poi(@$t1) == 0x7049c) { .lastevent; dt (combase!tagMSG)@$t1; g } .else { g }\"; g"
bp user32!SetWindowLongW ".lastevent; dps @esp L4; r $t0 = poi(@esp+c); .if ($t0 = 0) { g }"
bp user32!SetWindowLongW ".lastevent; dps @esp L4; r $t0 = poi(@esp+8); .if ($t0 = 0xffffffeb) { r @eip; } .else { g }"
bp user32!SetWindowLongW ".lastevent; dps @esp L4; .if (poi(@esp+8) = -2) { r @eip; } .else { g }"
When analyzing a TTD trace, it is quicker to list the function calls while extracting their parameters to anonymous objects, for example:
dx -g @$cursession.TTD.Calls("user32!NtUserSetWindowPos").Select(c => new { HWND = c.Parameters[0], WClass = @$scriptContents.findWindow(c.Parameters[0]).className, X = c.Parameters[2], Y = c.Parameters[3], TimeStart = c.TimeStart, SystemTime = c.SystemTimeStart })

dx -g @$cursession.TTD.Calls("user32!SetParentStub").Select(c => new { Child = c.Parameters[0], ChildClass = @$scriptContents.findWindow(c.Parameters[0]).className, Parent = c.Parameters[1], ParentClass = @$scriptContents.findWindow(c.Parameters[1]).className, TimeStart = c.TimeStart, SystemTime = c.SystemTimeStart })
I also created a winapi-user32.ps1 script, which decodes some of the window flag values to their text representation, for example:
# load script
. winapi-user32.ps1

# decode GWL_STYLE flag
Get-EnumFlagsFromMask -Enum ([GWL_STYLE]) -Mask 382664704
# WS_MAXIMIZEBOX
# WS_MINIMIZEBOX
# WS_THICKFRAME
# WS_SYSMENU
# WS_DLGFRAME
# WS_BORDER
# WS_CAPTION
# WS_CLIPCHILDREN
# WS_CLIPSIBLINGS
# WS_VISIBLE

# decode GWL_EXSTYLE flag
Get-EnumFlagsFromMask -Enum ([GWL_EXSTYLE]) -Mask 262400
# WS_EX_WINDOWEDGE
# WS_EX_APPWINDOW

Get-EnumFlagsFromMask ([SWP]) 20
# SWP_NOZORDER
# SWP_NOACTIVATE
Debugging system services (local remote debugging)
Attaching a debugger to a Windows service running in session 0 should not be a problem, assuming you have the SeDebugPrivilege and can access the service. However, debugging the service startup process can be challenging.
I typically use a WinDbg remote session over named pipes along with the Image File Execution Options registry key. The approach involves starting the service under a debugger (using the -server option), both running in session 0, and then connecting to the debugger server from a local debugger instance. Here is an example registry configuration for a testservice.exe:
Windows Registry Editor Version 5.00

[HKEY_LOCAL_MACHINE\SOFTWARE\Microsoft\Windows NT\CurrentVersion\Image File Execution Options\myapp.exe]
"Debugger"="windbgx.exe -Q -server npipe:pipe=svcpipe"
When the testservice starts, the debugger server will wait for the client to connect. You may start the client with the following command:
windbgx -remote "npipe:pipe=svcpipe,server=localhost"
If the Windows Service Manager stops the service before you manage to connect to it, you may need to adjust the service start timeout. For example, to set it to 3 minutes (180000 ms), use the following registry configuration:
Windows Registry Editor Version 5.00

[HKEY_LOCAL_MACHINE\SYSTEM\CurrentControlSet\Control]
"ServicesPipeTimeout"=dword:0002bf20
To terminate the entire session and exit the debugging server, use the q command. To exit from one debugging client without terminating the server, you must issue a command from that specific client. If this client is KD or CDB, use the CTRL+B key to exit. If you are using a script to run KD or CDB, use .remote_exit.
Troubleshooting network connectivity
Testing network connectivity
It is a common mistake to rely on ping when testing TCP connections. Ping uses a different protocol (ICMP) and although it is a fine tool to check if there is connectivity between two hosts (assuming ICMP traffic is not blocked), it will not tell us anything about opened TCP ports.
We may use the Test-NetConnection (tnc) cmdlet, for example:
tnc example.com -Port 443

# ComputerName     : example.com
# RemoteAddress    : 23.215.0.138
# RemotePort       : 443
# InterfaceAlias   : Ethernet
# SourceAddress    : 192.168.88.164
# TcpTestSucceeded : True
PsPing (a part of the Sysinternals toolkit) also has few interesting options when it comes to diagnosing network connectivity issues. The simplest usage is just a replacement for a ping.exe tool (performs ICMP ping):
psping www.google.com
By adding a port number at the end of the host we will test a TCP handshake (or discover a closed port on the remote host):
psping www.google.com:80
To test UDP add -u option on the command line.
Collecting network traces with pktmon
Switching to the command line tools, starting with Window 10 (Server 2019), we have a new network tracing tool in our arsenal: pktmon. It groups packets per components in the network stack, which is especially helpful when monitoring virtualized applications. Here are some usage examples:
# List active components in the network stack
pktmon component list

# Create a filter for TCP traffic for the 172.29.235.111 IP and the 8080 port
pktmon filter add -t tcp -i 172.29.235.111 -p 8080

# Show the configured filters
pktmon filter list

# Start the capturing session (-c) for all the components (--comp)
pktmon start -c --comp all && timeout -1 && pktmon stop

# Start the capture session (-c) for all NICs only (--comp), logging the entire
# packets (--pkt-size 0), overwriting the older packets when the output file
# reaches 512MB (-m circular -s 512)
pktmon start -c --comp nics --pkt-size 0 -m circular -s 512 -f c:\network-trace.etl && timeout -1 && pktmon stop
We may later convert the etl file to open it in Wireshark:
pktmon etl2pcap C:\network-trace.etl --out C:\network-trace.pcap
If the pcap file contains duplicate network packets, it is probably because same packets were logged by different network components. We can use the --comp parameter also in the etl2pcap subcommand to filter the packets, for example:
pktmon etl2pcap C:\network-trace.etl --out C:\network-trace.pcap --comp 12
If you don’t know the component number, you may use the etl2txt subcommand to list events in text format with their component IDs, and then pick the right component.
Collecting network traces with netsh (legacy way)
Netsh is another tool we could use for this purpose on Windows (even on older Windows versions). The netsh trace {start|stop} command will create an ETW-based network trace, allowing us to choose from a variety of diagnostics scenarios:
> netsh trace show scenarios

Available scenarios (18):
-------------------------------------------------------------------
AddressAcquisition       : Troubleshoot address acquisition-related issues
DirectAccess             : Troubleshoot DirectAccess related issues
FileSharing              : Troubleshoot common file and printer sharing problems
InternetClient           : Diagnose web connectivity issues
InternetServer           : Set of HTTP service counters
L2SEC                    : Troubleshoot layer 2 authentication related issues
LAN                      : Troubleshoot wired LAN related issues
Layer2                   : Troubleshoot layer 2 connectivity related issues
MBN                      : Troubleshoot mobile broadband related issues
NDIS                     : Troubleshoot network adapter related issues
NetConnection            : Troubleshoot issues with network connections
P2P-Grouping             : Troubleshoot Peer-to-Peer Grouping related issues
P2P-PNRP                 : Troubleshoot Peer Name Resolution Protocol (PNRP) related issues
RemoteAssistance         : Troubleshoot Windows Remote Assistance related issues
Virtualization           : Troubleshoot network connectivity issues in virtualization environment
WCN                      : Troubleshoot Windows Connect Now related issues
WFP-IPsec                : Troubleshoot Windows Filtering Platform and IPsec related issues
WLAN                     : Troubleshoot wireless LAN related issues
NOTE: For DHCP traces you may check netsh dhcpclient trace … commands. Also LAN and WLAN modes have some tracing capabilities which you may enable with a command netsh (w)lan set tracing mode=yes and stop with a command netsh (w)lan set tracing mode=no
To know exactly which providers are enabled in each scenario use netsh trace show scenario {scenarioname}. After choosing the right scenario for your diagnosing case start the trace, for example:
netsh trace start scenario=InternetClient capture=yes && timeout -1 && netsh trace stop
A new .etl file should be created in the output directory (as well as a .cab file with some interesting system logs). If you only need a trace file, you may add report=no tracefile=d:\temp\net.etl paramters. Some ETW providers do not generate information about the processes related to the specific events (for instance WFP provider) - keep this in mind when choosing your own set.
Many interesting capture filters are available, you may use netsh trace show CaptureFilterHelp to list them. Most interesting include CaptureInterface, Protocol, Ethernet, IPv4, and IPv6 options set, for example:
netsh trace start scenario=InternetClient capture=yes CaptureInterface="Local Area Connection 2" Protocol=TCP Ethernet.Type=IPv4 IPv4.Address=157.59.136.1 maxSize=250 fileMode=circular overwrite=yes traceFile=c:\temp\nettrace.etl
We can convert the generated .etl file to .pcapng with the etl2pcapng tool, and open them in Wireshark.
Measuring network latency
We start psping in a server mode on the connection target (-f for creating a temporary exception in the Windows Firewall, -s to enable server listening mode):
psping -f -s 192.168.1.3:4000
Then start the client and perform the test:
psping -l 16k -n 100 192.168.1.3:4000
Measuring network bandwidth
iperf is a tool that can measure bandwidth on Windows and Linux. We need to start the iperf server (-s) (the -e option is to enable enhanced output and -l sets the TCP read buffer size):
iperf -s -l 128k -p 8080 -e
Then, for an example test, we may run the client for 30s (-t) using two parallel threads (-P) and showing interval summaries every 2s (-i):
iperf -c 172.30.102.167 -p 8080 -l 128k -P 2 -i 2 -t 30
On Windows, we may alternatively use psping. Again, we need to run it in a server mode on the connection target (-f for creating a temporary exception in the Windows Firewall, -s to enable server listening mode):
psping -f -s 192.168.1.3:4000
Then start the client and perform the test:
psping -b -l 16k -n 100 192.168.1.3:4000
Debugging the system kernel
If you are a software developer, you may not have much experience with kernel debugging. But it can be very useful to know how to inspect kernel objects in some cases. For instance, you can troubleshoot thread waits in kernel-mode more effectively and find out the causes of dead-locks or hangs faster.
Enabling local kernel-mode debugging
To do full kernel debugging (so to control the kernel code execution) you need another Windows machine. But if you just want to analyse the kernel internal memory, you can enable local kernel debugging on your own machine. This is how you do it:
bcdedit /debug on
After a restart, you should be able to attach to your local kernel from WinDbg.
Another option is to use LiveKd which creates a snaphost of the kernel memory and attaches a debugger to it. It is also capable of creating a kernel memory dump for later analysis. An example command to create such a dump looks as follows:
livekd -accepteula -b -vsym -k "c:\Program Files (x86)\Windows Kits\10\Debuggers\x64\kd.exe" -o c:\tmp\kernel.dmp
You don’t need to boot the system in debugging mode to use livekd. So it is safe to use even in production environments.
Setting up remote Windows Kernel Debugging
Turn on network debugging (HOSTIP is the address of the machine on which we will run the debugger):
bcdedit /dbgsettings NET HOSTIP:192.168.0.2 PORT:60000
# Key=3ma3qyz02ptls.23uxbvnd0e2zh.1gnwiqb6v3mpb.mjltos9cf63x

bcdedit /debug {current} on
# The operation completed successfully.
Then on the host machine, run windbg, select Attach to kernel and fill the port and key textboxes.
When debugging a Hyper-V Gen 2 VM remember to turn off the secure booting:
Set-VMFirmware -VMName "Windows 2012 R2" -EnableSecureBoot Off -Confirm
If you are hosting your guest on QEMU KVM and want to use network debugging, you need to either create your VM as a Generic one (not Windows) or update the VM configuration XML, changing the vendor_id under the hyperv node, for example:
<domain type="kvm">
  <name>win2k19</name>
  <!-- ... -->
  <features>
    <acpi/>
    <apic/>
    <hyperv mode="custom">
      <relaxed state="on"/>
      <vapic state="on"/>
      <spinlocks state="on" retries="8191"/>
      <vendor_id state="on" value="KVMKVMKVM"/>
    </hyperv>
    <!-- ... -->
  </features>
  <!-- ... -->
</domain>
I highly recommend checking this post by the OSR team describing why those changes are required and revealing some details about the kdnet inner working.
Breaking when a user-mode process is created (kernel-mode)
bp nt!PspInsertProcess
The breakpoint is hit whenever a new user-mode process is created. To know what process is it we may access the _EPROCESS structure ImageFileName field.
# x64
dt nt!_EPROCESS @rcx ImageFileName
# x86
dt nt!_EPROCESS @eax ImageFileName
Setting a user-mode breakpoint in kernel-mode
You may set a breakpoint in user space, but you need to be in a valid process context:
!process 0 0 notepad.exe
# PROCESS ffffe0014f80d680
#     SessionId: 2  Cid: 0e44    Peb: 7ff7360ef000  ParentCid: 0aac
#     DirBase: 2d497000  ObjectTable: ffffc00054529240  HandleCount:
#     Image: notepad.exe

.process /i ffffe0014f80d680
# You need to continue execution (press 'g' ) for the context
# to be switched. When the debugger breaks in again, you will be in
# the new process context.

kd> g
Then when you are in a given process context, set the breakpoint:
.reload /user

!process -1 0
# PROCESS ffffe0014f80d680
#     SessionId: 2  Cid: 0e44    Peb: 7ff7360ef000  ParentCid: 0aac
#     DirBase: 2d497000  ObjectTable: ffffc00054529240  HandleCount:
#     Image: notepad.exe

x kernel32!CreateFileW
# 00007ffa`d8502508 KERNEL32!CreateFileW ()

bp 00007ffa`d8502508
Alternative way (which does not require process context switching) is to use data execution breakpoints, eg.:
!process 0 0 notepad.exe
# PROCESS ffffe0014ca22480
#     SessionId: 2  Cid: 0614    Peb: 7ff73628f000  ParentCid: 0d88
#     DirBase: 5607b000  ObjectTable: ffffc0005c2dfc40  HandleCount:
#     Image: notepad.exe

.process /r /p ffffe0014ca22480
# Implicit process is now ffffe001`4ca22480
# .cache forcedecodeuser done
# Loading User Symbols
# ..........................

x KERNEL32!CreateFileW
# 00007ffa`d8502508 KERNEL32!CreateFileW ()

ba e1 00007ffa`d8502508
For both those commands you may limit their scope to a particular process using /p switch.
Tools usage tips
WinDbg
Getting information about the debugging session
The | command displays a path to the process image. You may run vercommand to check how the debugger was launched. The vertarget command shows the OS version, the process lifetime, and more, for example, the dump time when debugging a memory dump. The .time command displays information about the system time variable (session time).
.lastevent shows the last reason why the debugger stopped and .eventlog displays the recent events.
Symbols and modules
The lm command lists all modules with symbol load info. To examine a specific module, use lmvm {module-name}. To find out if a given address belongs to any of the loaded dlls you may use the !dlls -c {addr} command. Another way would be to use the lma {addr} command.
The .sympath command shows the symbol search path and allows its modification. Use .reload /f {module-name} to reload symbols for a given module.
The x {module-name}!{function} command resolves a function address, and ln {address} finds the nearest symbol.
In WinDbgX, we may also list and filter modules with the @$curprocess.Modules property. Some usage examples:
# Display information about the win32u module
dx @$curprocess.Modules["win32u.dll"]

# Show public exports of the win32u module
dx @$curprocess.Modules["win32u.dll"].Contents.Exports

# List modules with information if they have combase.dll as a direct import
dx -g @$curprocess.Modules.Select(m => new { Name = m.Name, HasCombase = m.Contents.Imports.Any(i => i.ModuleName == "combase.dll") })
When we don’t have access to the symbol server, we may create a list of required symbols with symchk.exe (part of the Debugging Tools for Windows installation) and download them later on a different host. First, we need to prepare the manifest, for example:
symchk /id test.dmp /om test.dmp.sym /s C:\non-existing
Then copy it to the machine with the symbol server access, and download the required symbols, for example:
symchk /im test.dmp.sym /s SRV*C:\symbols*https://msdl.microsoft.com/download/symbols
If you want to add a PDB file (or files) to an existing symbol store, you may use the symstore add command, for example:
# /r – recursive, /o – verbose output, /f – a path to files to index (@ symbol before the name denotes a file which contains the list of files)
# /s – root directory of the store, /t – product name, /v – version, /c – comment
symstore add /r /o /f C:\src\myapp\bin /s \\symsrv\symbols\ /t myapp /v '1.0.1' /c 'rel 1.0.1'
General memory commands
The !address command shows information about a specific region of memory, for example:
!address 0x00fd7df8
# Usage:                  Image
# Base Address:           00fd6000
# End Address:            00fdc000
# Region Size:            00006000 (  24.000 kB)
# State:                  00001000          MEM_COMMIT
# Protect:                00000002          PAGE_READONLY
# Type:                   01000000          MEM_IMAGE
# Allocation Base:        00fb0000
# Allocation Protect:     00000080          PAGE_EXECUTE_WRITECOPY
# ...
Additionally, it can display regions of memory of specific type, for example:
!address -f:FileMap
#   BaseAddr EndAddr+1 RgnSize     Type       State                 Protect             Usage
# -----------------------------------------------------------------------------------------------
#   9a0000   9b0000    10000 MEM_MAPPED  MEM_COMMIT  PAGE_READWRITE                     MappedFile "PageFile"
#   9b0000   9b1000     1000 MEM_MAPPED  MEM_COMMIT  PAGE_READONLY                      MappedFile "PageFile"

!address -f:MEM_MAPPED
#   BaseAddr EndAddr+1 RgnSize     Type       State                 Protect             Usage
# -----------------------------------------------------------------------------------------------
#   9a0000   9b0000    10000 MEM_MAPPED  MEM_COMMIT  PAGE_READWRITE                     MappedFile "PageFile"
#   9b0000   9b1000     1000 MEM_MAPPED  MEM_COMMIT  PAGE_READONLY                      MappedFile "PageFile"
Examining the stack
Stack grows from high to low addresses. Thus, when you see addresses bigger than the frame base (such as ebp+C) they usually refer to the function arguments. Smaller addresses (such as ebp-20) usually refer to local function variables.
To display stack frames use the k command. The kP command will additionally print function arguments if private symbols are available. The kbM command outputs stack frames with first three parameters passed on the stack (those will be first three parameters of the function in x86).
When there are many threads running in a process it’s common that some of them have the same call stacks. To better organize call stacks we can use the !uniqstack command. Adding -b parameter adds first three parameters to the output, -v displays all parameters (but requires private symbols).
To switch a local context to a different stack frame we can use the .frame command:
.frame [/c] [/r] [FrameNumber]
.frame [/c] [/r] = BasePtr [FrameIncrement]
.frame [/c] [/r] = BasePtr StackPtr InstructionPtr
The !for_each_frame extension command enables you to execute a single command repeatedly, once for each frame in the stack.
In WinDbgX, we may access the call stack frames using @$curstack.Frames, for example:
dx @$curstack.Frames
# @$curstack.Frames
#     [0x0]            : ntdll!LdrpDoDebuggerBreak + 0x30 [Switch To]
#     [0x1]            : ntdll!LdrpInitializeProcess + 0x1cfa [Switch To]

dx @$curstack.Frames[0].Attributes
# InstructionOffset : 0x7ffa1102b784
# ReturnOffset     : 0x7ffa1102e9d6
# FrameOffset      : 0xea5055f370
# StackOffset      : 0xea5055f340
# FuncTableEntry   : 0x0
# Virtual          : 1
# FrameNumber      : 0x0
# SourceInformation
Variables
When you have private symbols you may list local variables with the dv command.
Additionally the dt command allows you to work with type symbols. You may either list them, eg.: dt notepad!g_* or dump a data address using a given type format, eg.: dt nt!_PEB 0x13123.
The dx command allows you to dump local variables or read them from any place in the memory. It uses a navigation expressions just like Visual Studio (you may define your own file .natvis files). You load the interesting .natvis file with the .nvload command.
#FIELD_OFFSET(Type, Field) is an interesting operator which returns the offset of the field in the type, eg. ? #FIELD_OFFSET(_PEB, ImageSubsystemMajorVersion).
Strings
The !du command from the PDE extension shows strings up to 4GB (the default du command stops when it hits the range limit).
The PDE extension also contains the !ssz command to look for zero-terminated (either unicode or ascii) strings. To change a text in memory use !ezu, for example: ezu "test string". The extension works on committed memory.
Another interesting command is !grep, which allows you to filter the output of other commands: !grep _NT !peb.
Fixed size arrays
Printing an array of a specific size with dx might be tricky. The code below shows two ways of printing a fixed-size char array:
dx (*((char (*)[16])0x31aa5526)),c
# (*((jvm!char (*)[16])0x31aa5526)),c                 [Type: char [16]]
#     [0]              : 106 'j' [Type: char]
#     ...
#     [15]             : 116 't' [Type: char]

dx ((char*)0x31aa5526),16c
# ((char*)0x31aa5526),16c                 : 0x31aa5526 [Type: char *]
#     [0]              : 106 'j' [Type: char]
#     ...
#     [15]             : 116 't' [Type: char]
Altenatively, we could use db 0x31aa5526 L10.
System objects in the debugger
The !object command displays some basic information about a kernel object:
!object  ffffc30162f26080
# Object: ffffc30162f26080  Type: (ffffc30161891d20) Process
#     ObjectHeader: ffffc30162f26050 (new version)
#     HandleCount: 23  PointerCount: 582900
We may then analyze the object header to learn some more details about the object, for example:
dx (nt!_OBJECT_HEADER *)0xffffc30162f26050
# (nt!_OBJECT_HEADER *)0xffffc30162f26050                 : 0xffffc30162f26050 [Type: _OBJECT_HEADER *]
#     [+0x000] PointerCount     : 582900 [Type: __int64]
#     [+0x008] HandleCount      : 23 [Type: __int64]
#     [+0x008] NextToFree       : 0x17 [Type: void *]
#     [+0x010] Lock             [Type: _EX_PUSH_LOCK]
#     [+0x018] TypeIndex        : 0x5 [Type: unsigned char]
#     [+0x019] TraceFlags       : 0x0 [Type: unsigned char]
#     [+0x019 ( 0: 0)] DbgRefTrace      : 0x0 [Type: unsigned char]
#     [+0x019 ( 1: 1)] DbgTracePermanent : 0x0 [Type: unsigned char]
#     [+0x01a] InfoMask         : 0x88 [Type: unsigned char]
#     [+0x01b] Flags            : 0x0 [Type: unsigned char]
#     [+0x01b ( 0: 0)] NewObject        : 0x0 [Type: unsigned char]
#     [+0x01b ( 1: 1)] KernelObject     : 0x0 [Type: unsigned char]
#     [+0x01b ( 2: 2)] KernelOnlyAccess : 0x0 [Type: unsigned char]
#     [+0x01b ( 3: 3)] ExclusiveObject  : 0x0 [Type: unsigned char]
#     [+0x01b ( 4: 4)] PermanentObject  : 0x0 [Type: unsigned char]
#     [+0x01b ( 5: 5)] DefaultSecurityQuota : 0x0 [Type: unsigned char]
#     [+0x01b ( 6: 6)] SingleHandleEntry : 0x0 [Type: unsigned char]
#     [+0x01b ( 7: 7)] DeletedInline    : 0x0 [Type: unsigned char]
#     [+0x01c] Reserved         : 0x62005c [Type: unsigned long]
#     [+0x020] ObjectCreateInfo : 0xffffc301671872c0 [Type: _OBJECT_CREATE_INFORMATION *]
#     [+0x020] QuotaBlockCharged : 0xffffc301671872c0 [Type: void *]
#     [+0x028] SecurityDescriptor : 0xffffd689feeef0ea [Type: void *]
#     [+0x030] Body             [Type: _QUAD]
#     ObjectType       : Process
#     UnderlyingObject [Type: _EPROCESS]

dx -r1 (*((ntkrnlmp!_EPROCESS *)0xffffc30162f26080))
# (*((ntkrnlmp!_EPROCESS *)0xffffc30162f26080))                 [Type: _EPROCESS]
#     [+0x000] Pcb              [Type: _KPROCESS]
#     [+0x438] ProcessLock      [Type: _EX_PUSH_LOCK]
#     [+0x440] UniqueProcessId  : 0x1488 [Type: void *]
#     [+0x448] ActiveProcessLinks [Type: _LIST_ENTRY]
#     [+0x458] RundownProtect   [Type: _EX_RUNDOWN_REF]
#     [+0x460] Flags2           : 0x200d014 [Type: unsigned long]
#     [+0x460 ( 0: 0)] JobNotReallyActive : 0x0 [Type: unsigned long]
#     [+0x460 ( 1: 1)] AccountingFolded : 0x0 [Type: unsigned long]
#     [+0x460 ( 2: 2)] NewProcessReported : 0x1 [Type: unsigned long]
#     ...
Processes (kernel-mode)
Each time you break into the kernel-mode debugger, one of the processes will be active. You may learn which one by running the !process -1 0 command. If you are going to work with user-mode memory space you need to reload the process modules symbols (otherwise you will see symbols from the last reload). You may do so while switching process context with .process /i (/i means invasive debugging and allows you to control the process from the kernel debugger) or .process /r /p (/r reloads user-mode symbols after the process context has been set (the behavior is the same as .reload /user), /p translates all transition page table entries (PTEs) for this process to physical addresses before access).
!peb shows loaded modules, environment variables, command line arg, and more.
The !process 0 0 {image} command finds a proces using its image name, e.g.: !process 0 0 LINQPad.UserQuery.exe.
When we know the process ID, we may use !process {PID | address} 0x7 (the 0x7 flag will list all the threads with their stacks).
Handles
There is a special debugger extension command !handle that allows you to find system handles reserved by a process.
To list all handles reserved by a process use -1 (in kernel mode) or 0 (in user-mode). You may filter the list by setting a type of a handle:
!handle 0 1 File
# ...
# Handle 1c0
#   Type          File
# 7 handles of type File
Threads
The !thread {addr} command shows details about a specific thread. Each thread has its own register values. These values are stored in the CPU registers when the thread is executing and are stored in memory when another thread is executing. You can set the register context using .thread command:
.thread [/p [/r] ] [/P] [/w] [Thread]
or
.trap [Address]
.cxr [Options] [Address]
For WOW64 processes, the /w parameter (.thread /w) will additionally switch to the x86 context. After loading the thread context, the commands opearating on stack should start working (remember to be in the right process context).
To list all threads in a current process use the ~*command (user-mode). Dot (.) in the first column signals a currently selected thread and hash (#) points to a thread on which an exception occurred.
!runaway shows the time consumed by each thread:
!runaway 7
# User Mode Time
#  Thread       Time
#   0:bfc       0 days 0:00:00.031
#   3:10c       0 days 0:00:00.000
#   2:844       0 days 0:00:00.000
#   1:15bc      0 days 0:00:00.000
# Kernel Mode Time
#  Thread       Time
#   0:bfc       0 days 0:00:00.046
#   3:10c       0 days 0:00:00.000
#   2:844       0 days 0:00:00.000
#   1:15bc      0 days 0:00:00.000
# Elapsed Time
#  Thread       Time
#   0:bfc       0 days 0:27:19.817
#   1:15bc      0 days 0:27:19.810
#   2:844       0 days 0:27:19.809
#   3:10c       0 days 0:27:19.809
~~[thread-id] - in case you would like to use the system thread id you may with this syntax.
!tls Slot extension displays a thread local storage slot (or -1 for all slots)
Critical sections
Display information about a particular critical section: !critsec {address}.
!locks extension in Ntsdexts.dll displays a list of critical sections associated with the current process.
!cs -lso [Address] - display information about critical sections (-l - only locked critical sections, -o - owner’s stack, -s - initialization stack, if available)
!critsec Address - information about a specific critical section
!cs -lso
# -----------------------------------------
# DebugInfo          = 0x77294380
# Critical section   = 0x772920c0 (ntdll!LdrpLoaderLock+0x0)
# LOCKED
# LockCount          = 0x10
# WaiterWoken        = No
# OwningThread       = 0x00002c78
# RecursionCount     = 0x1
# LockSemaphore      = 0x194
# SpinCount          = 0x00000000
# -----------------------------------------
# DebugInfo          = 0x00581850
# Critical section   = 0x5164a394 (AcLayers!NS_VirtualRegistry::csRegCriticalSection+0x0)
# LOCKED
# LockCount          = 0x4
# WaiterWoken        = No
# OwningThread       = 0x0000206c
# RecursionCount     = 0x1
# LockSemaphore      = 0x788
# SpinCount          = 0x00000000
Finally, we may use the raw output:
dx -r1 ((ole32!_RTL_CRITICAL_SECTION_DEBUG *)0x581850)
# ((ole32!_RTL_CRITICAL_SECTION_DEBUG *)0x581850)                 : 0x581850 [Type: _RTL_CRITICAL_SECTION_DEBUG *]
#     [+0x000] Type             : 0x0 [Type: unsigned short]
#     [+0x002] CreatorBackTraceIndex : 0x0 [Type: unsigned short]
#     [+0x004] CriticalSection  : 0x5164a394 [Type: _RTL_CRITICAL_SECTION *]
#     [+0x008] ProcessLocksList [Type: _LIST_ENTRY]
#     [+0x010] EntryCount       : 0x0 [Type: unsigned long]
#     [+0x014] ContentionCount  : 0x6 [Type: unsigned long]
#     [+0x018] Flags            : 0x0 [Type: unsigned long]
#     [+0x01c] CreatorBackTraceIndexHigh : 0x0 [Type: unsigned short]
#     [+0x01e] SpareUSHORT      : 0x0 [Type: unsigned short]
Controlling process execution
Controlling the target (g, t, p)
To go up the funtion use gu command. We can go to a specified address using ga [address]. We can also step or trace to a specified address using accordingly pa and ta commands.
Useful commands are pc and tc which step or trace to the next call statement. pt and tt step or trace to the next return statement.
Watch trace
wt is a very powerful command and might be excellent at revealing what the function under the cursor is doing, eg. (-oa displays the actual address of the call sites, -or displays the return register values):
wt -l1 -oa -or
# Tracing notepad!NPInit to return address 00007ff6`72c23af5
#    11     0 [  0] notepad!NPInit
#                       call at 00007ff6`72c27749
#    14     0 [  1]   notepad!_chkstk rax = 1570
#    20    14 [  0] notepad!NPInit
#                       call at 00007ff6`72c27772
#    11     0 [  1]   USER32!RegisterWindowMessageW rax = c06f
#    26    25 [  0] notepad!NPInit
#                       call at 00007ff6`72c2778f
#    11     0 [  1]   USER32!RegisterWindowMessageW rax = c06c
#    31    36 [  0] notepad!NPInit
#                       call at 00007ff6`72c277a5
#     6     0 [  1]   USER32!NtUserGetDC rax = 9011652
# >> More than one level popped 0 -> 0
#    37    42 [  0] notepad!NPInit
#                       call at 00007ff6`72c277bc
#  1635     0 [  1]   notepad!InitStrings rax = 1
#    42  1677 [  0] notepad!NPInit
#                       call at 00007ff6`72c277d0
#     8     0 [  1]   USER32!LoadCursorW rax = 10007
#    46  1685 [  0] notepad!NPInit
#                       call at 00007ff6`72c277e4
#     8     0 [  1]   USER32!LoadCursorW rax = 10009
#    50  1693 [  0] notepad!NPInit
#                       call at 00007ff6`72c277fb
#    24     0 [  1]   USER32!LoadAcceleratorsW
#    24     0 [  1]   USER32!LoadAcc rax = 0
#    59  1741 [  0] notepad!NPInit
#                       call at 00007ff6`72c27d84
#     6     0 [  1]   notepad!_security_check_cookie rax = 0
#    69  1747 [  0] notepad!NPInit
#
# 1816 instructions were executed in 1815 events (0 from other threads)
#
# Function Name                               Invocations MinInst MaxInst AvgInst
# USER32!LoadAcc                                        1      24      24      24
# USER32!LoadAcceleratorsW                              1      24      24      24
# USER32!LoadCursorW                                    2       8       8       8
# USER32!NtUserGetDC                                    1       6       6       6
# USER32!RegisterWindowMessageW                         2      11      11      11
# notepad!InitStrings                                   1    1635    1635    1635
# notepad!NPInit                                        1      69      69      69
# notepad!_chkstk                                       1      14      14      14
# notepad!_security_check_cookie                        1       6       6       6
#
# 1 system call was executed
#
# Calls  System Call
#     1  USER32!NtUserGetDC
The first number in the trace output specifies the number of instructions that were executed from the beginning of the trace in a given function (it is always incrementing), the second number specifies the number of instructions executed in the child functions (it is also always incrementing), and the third represents the depth of the function in the stack (parameter -l).
If the wt command does not work, you may achieve similar results manually with the help of the target controlling commands:
- stepping until a specified address:
ta,pa - stepping until the next branching instruction:
th,ph - stepping until the next call instruction:
tc,pc - stepping until the next return:
tt,pt - stepping until the next return or call instruction:
tct,pct
Breaking when a specific function is in the call stack
bp Module!MyFunctionWithConditionalBreakpoint "r $t0 = 0;.foreach (v { k }) { .if ($spat(\"v\", \"*Module!ClassA:MemberFunction*\")) { r $t0 = 1;.break } }; .if($t0 = 0) { gc }"
Breaking on a specific function enter and leave
The trick is to set a one-time breakpoint on the return address (bp /1 @$ra) when the main breakpoint is hit, for example:
bp 031a6160 "dt ntdll!_GUID poi(@esp + 8); .printf /D \"==> obj addr: %p\", poi(@esp + C);.echo; bp /1 @$ra; g"
bp kernel32!RegOpenKeyExW "du @rdx; bp /1 @$ra \"r @$retreg; g\"; g"
bp kernelbase!CreateFileW ".printf \"CreateFileW('%mu', ...)\", @rcx; bp /1 @$ra \".printf \\\" => %p\\\\n\\\", @rax; g\"; g"
bp kernelbase!DeviceIoControl ".printf \"DeviceIoControl(%p, %p, ...)\\n\", @rcx, @rdx; g"
bp kernelbase!CloseHandle ".printf \"CloseHandle(%p)\\n\", @rcx;g"
Remove the ‘g’ commands from the above samples if you want the debugger to stop.
Breaking for all methods in the C++ object virtual table
This could be useful when debugging COM interfaces, as in the example below. When we know the number of methods in the interface and the address of the virtual table, we may set the breakpoint using the .for loop, for example:
.for (r $t0 = 0; @$t0 < 5; r $t0= @$t0 + 1) { bp poi(5f4d8948 + @$t0 * @$ptrsize) }
Scripting the debugger
Using meta-commands (legacy way)
WinDbg contains several meta-commands (starting with a dot) that allow you to control the debugger actions. The .expr command prints the expression evaluator (MASM or C++) that will be used when interpreting the symbols in the executed commands. You may use the /s to change it. The ? command uses the default evaluator, and ?? always uses the C++ evaluator. Also, you can mix the evaluators in one expression by using @@c++(expression) or @@masm(expression) syntax, for example: ? @@c++(@$peb->ImageSubsystemMajorVersion) + @@masm(0y1).
When using .if and .foreach, sometimes the names are not resolved - use spaces between them. For example, the command would fail if there was no space between poi( and addr in the code below.
.foreach (addr {!DumpHeap -mt 71d75b24 -short}) { .if (dwo(poi( addr + 5c ) + c)) { !do addr } }
Using the dx command
The dx command allows us to query the Debugger Object Model. Here you may find the list of its properties collected on the version 1.2603.20001.0 of WinDbg.
There is a set of root objects from which we may start our query, including @$cursession, @$curprocess, @$curthread, @$curstack, or @$curframe.
dx Debugger.State shows the current state of the debugger. The -h parameter additionally displays help for the debugger objects, for example:
dx -h Debugger.State
# Debugger.State                 [State pertaining to the current execution of the debugger (e.g.: user variables)]
#     DebuggerInformation [Debugger variables which are owned by the debugger and can be referenced by a pseudo-register prefix of @$]
#     DebuggerVariables [Debugger variables which are owned by the debugger and can be referenced by a pseudo-register prefix of @$]
#     FunctionAliases  [Functions aliased to names which are accessible via a pseudo-register prefix of @$ or executable via a '!' command prefix]
#     PseudoRegisters  [Categorizied debugger managed pseudo-registers which can be referenced by a pseudo-register prefix of @$]
#     Scripts          [Scripts which have been loaded into the debugger and have properties, methods, or other accessible constructs]
#     UserVariables    [User variables which are maintained by the debugger and can be referenced by a pseudo-register prefix of @$]
#     ExtensionGallery [Extension Gallery]
If we add the -v parameter, dx will print not only the values of the properties and fields but also the methods we may call on an object:
dx -v -r1 Debugger.Sessions[0].Processes[15416].Threads[12796]
# Debugger.Sessions[0].Processes[15416].Threads[12796]                 [Switch To]
#     Id               : 0x31fc
#     Index            : 0x0
#     Stack
#     Registers
#     SwitchTo         [SwitchTo() - Switch to this thread as the default context]
#     Environment
#     TTD
#     ToDisplayString  [ToDisplayString([FormatSpecifier]) - Method which converts the object to its display string representation according to an optional format specifier]
In our queries we may create anonymous objets, lambdas, arrays and objects of the Debugger Object Model types, for example:
# Create an anonymous object for each call to RtlSetLastWin32Error that contains TTD time of the call and the error code value
dx -g @$cursession.TTD.Calls("ntdll!RtlSetLastWin32Error").Select(c => new { TimeStart = c.TimeStart, Error = c.Parameters[0] })
# =========================================
# =           = (+) TimeStart = Error     =
# =========================================
# = [0x0]     - 725:3B        - 0xbb      =
# = [0x1]     - 725:3D6       - 0x57      =
# = [0x2]     - 725:4AA       - 0x57      =
# = [0x3]     - 725:EF0       - 0xbb      =
# ....

# Create a simple array containing four numbers
dx Debugger.Utility.Collections.CreateArray(1, 2, 3, 4)
# Debugger.Utility.Collections.CreateArray(1, 2, 3, 4)
#     [0x0]            : 1
#     [0x1]            : 2
#     [0x2]            : 3
#     [0x3]            : 4

# Create a TTD position object and use it to set the current trace position
dx -s @$create("Debugger.Models.TTD.Position", 4173, 75).SeekTo()

# Create a lambda function to sum two numbers
dx ((x, y) => x + y)(1, 2)
# ((x, y) => x + y)(1, 2) : 3
Additionally, we may assign the created object or the result of a dx query to a variable, for example:
# Assign a lambda function to a $sum variable and use it
dx @$sum = (x, y) => x + y
dx @$sum(1, 2)
# @$sum(1, 2)      : 3

# Save all calls to the CreateFileW function to the @$calls variable
dx @$calls = @$cursession.TTD.Calls("kernelbase!CreateFileW")
We may also use variables and pseudo-registers available in the debugger context. You may list them by examining the Debugger.State.DebuggerVariables, Debugger.State.PseudoRegisters, and Debugger.State.UserVariables objects.
The FileSystem API allows us to access the host file system. To have the full control over the lifetime of the opened file handle, I recommend using the file object explicitly. The following code is an example when we read all lines from a file to an array:
dx @$file = Debugger.Utility.FileSystem.OpenFile("c:\\temp\\test.txt")
dx @$lines = Debugger.Utility.FileSystem.CreateTextReader(@$file).ReadLineContents().ToArray()
dx @$file.Close()
Example queries with explanations:
# Find kernel32 exports that contain the 'RegGetVal' string (by Tim Misiak)
dx @$curprocess.Modules["kernel32"].Contents.Exports.Where(exp => exp.Name.Contains("RegGetVal"))

# Show the address of the exported RegGetValueW function (by Tim Misiak)
dx -r1 @$curprocess.Modules["kernel32"].Contents.Exports.Single(exp => exp.Name == "RegGetValueW").CodeAddress

# Set a breakpoint on every exported function of the bindfltapi module
dx @$curprocess.Modules["bindfltapi"].Contents.Exports.Select(m =>  Debugger.Utility.Control.ExecuteCommand($"bp {m.CodeAddress}"))

# Show the number of calls made to functions with names starting from NdrClient in the rpcrt4 module
dx -g @$cursession.TTD.Calls("rpcrt4!NdrClient*").GroupBy(c => c.Function).Select(g => new { Function = g.First().Function, Count = g.Count() })
More examples of the dx queries for analysing the TTD traces can be found in the TTD guide.
The SOS extension does not currently support the Debugger Object Models, but we can see that some of the debugger objects understand the managed context. For example, when we list stack frames of a managed process, the method names should be properly decoded:
dx -r1 @$curprocess.Threads[13236].Stack.Frames
# @$curprocess.Threads[13236].Stack.Frames
#     [0x0]            : ntdll!NtReadFile + 0x14 [Switch To]
#     [0x1]            : KERNELBASE!ReadFile + 0x7b [Switch To]
#     [0x2]            : System_Console!Interop.Kernel32.ReadFile + 0x84 [Switch To]
#     [0x3]            : System_Console!System.ConsolePal.WindowsConsoleStream.ReadFileNative + 0x60 [Switch To]
#     [0x4]            : System_Console!System.ConsolePal.WindowsConsoleStream.Read + 0x2b [Switch To]
#     [0x5]            : System_Console!System.IO.ConsoleStream.Read + 0x74 [Switch To]
#     [0x6]            : System_Private_CoreLib!System.IO.StreamReader.ReadBuffer + 0x268 [Switch To]
#     [0x7]            : System_Private_CoreLib!System.IO.StreamReader.ReadLine + 0xd3 [Switch To]
#     [0x8]            : System_Console!System.IO.SyncTextReader.ReadLine + 0x3d [Switch To]
#     [0x9]            : System_Console!System.Console.ReadLine + 0x19 [Switch To]
#     [0xa]            : testcs!Program.Main + 0xc6 [Switch To]
#     ...

dx -r1 @$curprocess.Threads[13236].Stack.Frames[10]
# @$curprocess.Threads[13236].Stack.Frames[10]                 : testcs!Program.Main + 0xc6 [Switch To]
#     LocalVariables
#     Parameters       : ()
#     Attributes

dx -r1 @$curprocess.Threads[13236].Stack.Frames[10].LocalVariables
# @$curprocess.Threads[13236].Stack.Frames[10].LocalVariables
#     ex               : 0x0 [Type: System.Exception]
#     slot0            [Type: System.Runtime.CompilerServices.DefaultInterpolatedStringHandler]
#     ...
Additionally, we may query the managed heap (the ManagedHeap property is a nice replacement for the !DumpHeap command):
dx -r1 @$curprocess.Memory.ManagedHeap
# @$curprocess.Memory.ManagedHeap
#     GCHandles
#     Objects
#     ObjectsByType

dx -r1 @$curprocess.Memory.ManagedHeap.Objects
# @$curprocess.Memory.ManagedHeap.Objects
#     [0x0]            : 0x1ab6fc00020   size = 60   type = int[]
#     [0x1]            : 0x1ab6fc00080   size = 80   type = System.OutOfMemoryException
#     [0x2]            : 0x1ab6fc00100   size = 80   type = System.StackOverflowException
#     [0x3]            : 0x1ab6fc00180   size = 80   type = System.ExecutionEngineException
#     [0x4]            : 0x1ab6fc00200   size = 18   type = System.Object
#     [0x5]            : 0x1ab6fc00218   size = 18   type = System.String
#     [0x6]            : 0x1ab6fc00230   size = 50   type = System.Collections.Generic.Dictionary<string,object>
#     [0x7]            : 0x1ab6fc00280   size = 48   type = System.String
#     [...]
Using the JavaScript engine
Links:
- Official Microsoft documentation
- The API reference for the host object
- Debugger data model, Javascript & x64 exception handling - a great article on scripting the debugger by Alex “0vercl0k” Souchet
The .scriptproviders command must include the JavaScript provider in the output.
Then we may run a script with the .scriptrun command or load it using the .scriptload command. The difference is that model modifications made by the .scriptload will stay in place until the call to .scriptunload. Also, .scriptrun will call the invokeScript JS function after the usual calls to the root code and the initializeScript function.
.scriptlist lists the loaded scripts.
After loading a script file, we may find it in the Debugger.State.Scripts list (.scriptlist will show it, too):
.scriptload c:\windbg-js\windbg-scripting.js
# JavaScript script successfully loaded from 'c:\windbg-js\windbg-scripting.js'

dx -r1 Debugger.State.Scripts
# Debugger.State.Scripts
#     windbg-scripting
Then we are ready to call any defined public function, for example, logn:
dx Debugger.State.Scripts.@"windbg-scripting".Contents.logn("test")
# test

Debugger.State.Scripts.@"windbg-scripting".Contents.logn("test")
The @$scriptContents variable is a shortcut to all the public functions from all the loaded scripts, so our call could be more compact:
dx @$scriptContents.logn("test")
# test

@$scriptContents.logn("test")
The Number type in JavaScript has a 53-bit limitation, which prevents us from working with 64-bit types. Fortunately, WinDbg provides us with the Int64 type with methods for operations on 64-bit numbers such as getLowPart, getHighPart, bitwiseAnd, or bitwiseShiftLeft (others in the documentation). It also has a properly implemented toString and can be safely used for hexadecimal conversion of data from the debugger, for example:
function initializeScript()
{
    return [new host.apiVersionSupport(1, 7), new host.functionAlias(runTest, "runTest")]
}

function __hexString2(n) {
    return n.toString(16);
}

function runTest(n) {
    return __hexString2(n);
}
dx @$n = 0xffffffffffffffff
# @$n = 0xffffffffffffffff : -1

!runTest(@$n)
# @$runTest(@$n)   : ffffffffffffffff
#     Length           : 0x10
Additiona, the JS provider tracks created Int64 objects and, if an object for a given value already exists, it will be returned, for example:
const call = host.currentSession.TTD.Calls("combase!CoCreateInstance").First();

const ppv = call.Parameters.ppv.address;

call.TimeEnd.SeekTo();

const cobj = host.evaluateExpression(`*(void **)${ppv}`).address;
const i2 = new host.Int64(cobj);

const m = new Map();
m.set(i2, clsid);
m.set(cobj, clsid);
// the m size is 1
__logn(`m size : ${m.size}`);
The host.namespace gives us access to the debuggerRootNamespace which we normally use with the dx command:
dx @$debuggerRootNamespace
# @$debuggerRootNamespace
#     Debugger
var ctl = host.namespace.Debugger.Utility.Control;
ctl.ExecuteCommand(".process /p /r " + procId);
DML might pollute the command output. If that’s the case, you may disable it with the .prefer_dml 0 command.
The host.evaluateExpression allows to evaluate expressions, for eaxmple:
function exc(addr) {
    let exceptionRecord = host.evaluateExpression(`(_EXCEPTION_RECORD*)${addr}`);
    let exceptionCode = host.evaluateExpression(`(DWORD)${exceptionRecord.ExceptionCode}`)

    if (exceptionCode === 0xe06d7363) {
        println("== EH exception ==");
        exceptionRecord.
    } else {
        logn(`Other exception: ${exceptionCode}`)
    }
}
It is quite slow, so using it in frequently executed functions is not practical.
After we loaded the script (.scriptload), we may also debug its parts thanks to the .scriptdebug command, for example:
.scriptload c:\windbg-js\strings.js

.scriptdebug strings.js

# *** Inside JS debugger context ***
|
#     ...
#     [11] NatVis script from 'C:\Program Files\WindowsApps\Microsoft.WinDbg_1.2308.2002.0_x64__8wekyb3d8bbwe\amd64\Visualizers\winrt.natvis'
#     [12] [*DEBUGGED*] JavaScript script from 'c:\windbg-js\strings.js'
#
bp logn
# Breakpoint 1 set at logn (11:5)
bl
#       Id State    Pos
#        1 enabled  11:5
#
q
We are running a debugger in the debugger, so it could be a bit confusing :) After quitting the JavaScript debugger, it will keep the breakpoints information, so when we call our function from the main debugger, we will land in the JavaScript debugger again, for example:
dx @$scriptContents.logn("test")
# >>> ****** SCRIPT BREAK strings [Breakpoint 1] ******
#            Location: line = 11, column = 5
#            Text: log(s + "\n")
#
# *** Inside JS debugger context ***
dv
#                    s = test
The number of commands available in the inner JavaScript debugger is quite long and we may list them with the .help command. Especially, the evaluate expression (? or ??) are very useful as they allow us to execute any JavaScript expressions and check their results:
? host
# host             : {...}
#     __proto__        : {...}
#     ...
#     Int64            : function () { [native code] }
#     parseInt64       : function () { [native code] }
#     namespace        : {...}
#     evaluateExpression : function () { [native code] }
#     evaluateExpressionInContext : function () { [native code] }
#     getModuleSymbol  : function () { [native code] }
#     getModuleContainingSymbol : function () { [native code] }
#     getModuleContainingSymbolInformation : function () { [native code] }
#     getModuleSymbolAddress : function () { [native code] }
#     setModuleSymbol  : function () { [native code] }
#     getModuleType    : function () { [native code] }
#     ...
We can also execute commands from a script file. We use the $$ command family for that purpose. The -c option allows us to run a command on a debugger launch. So if we pass the $$< command with a file path, windbg will read the file and execute the commands from it as if they were entered manually, for example:
windbgx -c "$$<test.txt" notepad
And the test.txt content:
sxe -c ".echo advapi32; g" ld:advapi32
g
We may use the $$>args< command variant to pass arguments to our script.
When analyzing multiple files, I often use PowerShell to call WinDbg with the commands I want to run. In each WinDbg session, I pass the output of the commands to the windbg.log file, for example:
Get-ChildItem .\dumps | % { Start-Process -Wait -FilePath windbg-x64\windbg.exe -ArgumentList @("-loga", "windbg.log", "-y", "`"SRV*C:\dbg\symbols*https://msdl.microsoft.com/download/symbols`"", "-c", "`".exr -1; .ecxr; k; q`"", "-z", $_.FullName) }
To make a comment, you can use one of the comment commands: $$ my comment or * my comment. The difference between them is that * comments everything till the end of the line, while $$ comments text till the semicolon (or end of a line), e.g., r eax; $$ some text; r ebx; * more text; r ecx will print eax, ebx but not ecx. The .echo command ends if the debugger encounters a semicolon (unless the semicolon occurs within a quoted string).
Converting a memory dump from one format to another
When debugging a full memory dump (/ma), we may convert it to a smaller memory dump using again the .dump command, for example:
.dump /mpi c:\tmp\smaller.dmp
Loading an arbitrary DLL into WinDbg for analysis
WinDbg allows analysis of an arbitrary PE file if we load it as a crash dump (the Open dump file menu option or the -z command-line argument), for example: windbgx -z C:\Windows\System32\shell32.dll. WinDbg will load a DLL/EXE as a data file.
Alternatively, if we want to normally load the DLL, we may use rundll32.exe as our debugging target and wait until the DLL gets loaded, for example: windbgx -c "sxe ld:jscript9.dll;g" rundll32.exe .\jscript9.dll,TestFunction. The TestFunction in the snippet could be any string. Rundll32.exe loads the DLL before validating the exported function address.
Keyboard and mouse shortcuts
The SHIFT + [UP ARROW] completes the current command from previously executed commands (much as F8 in cmd).
If you double-click on a word in the command window in WinDbgX, the debugger will highlight all occurrences of the selected term. You may highlight other words with different colors if you press the ctrl key when double-clicking on them. To unhighlight a given word, double-click on it again, pressing the ctrl key.
Running a WinDbg command for all the processes
dx -r2 @$cursession.Processes.Where(p => p.Name == "test.exe").Select(p => Debugger.Utility.Control.ExecuteCommand("|~[0n" + p.Id + "]s;bp testlib!TestMethod \".lastevent; r @rdx; u poi(@rdx); g\""))
Attaching to multiple processes at once
In PowerShell:
Get-Process -Name disp+work | where Id -ne 6612 | % { ".attach -b 0n$($_.Id)" } | Out-File -Encoding ascii c:\tmp\attach_all.txt
windbgx.exe -c "`$`$<C:\tmp\attach_all.txt" -pn winver.exe
Injecting a DLL into a process being debugged
You may use the !injectdll command from my lldext extension.
Or use the .call method, as shown in the shell32.dll example below. We start by allocating some space for the DLL name and filling it up:
.dvalloc 0x1a
# Allocated 1000 bytes starting at 00000279`c1be0000

ezu 00000279`c1be0000 "shell32.dll"

du 00000279`c1be0000
# 00000279`c1be0000  "shell32.dll"
The .call command requires private symbols. Microsoft does not publish public symbols for KernelBase!LoadLibraryW, but we may create them (thanks to the SymbolBuilderComposition extension):
? kernelbase!LoadLibraryW - kernelbase
# Evaluate expression: 533568 = 00000000`00082440

.load c:\dbg64ex\SymbolBuilderComposition.dll

dx @$sym = Debugger.Utility.SymbolBuilder.CreateSymbols("kernelbase.dll")

dx @$fnLoadLibraryW = @$sym.Functions.Create("LoadLibraryW", "void*", 0x0000000000082440, 0x8)
dx @$param =  @$fnLoadLibraryW.Parameters.Add("lpLibFileName", "wchar_t*")
dx @$param.LiveRanges.Add(0, 8, "@rcx")

.reload /f kernelbase.dll

.call kernelbase!LoadLibraryW(0x00000279`c1be0000)

~.g

lm
# start             end                 module name
# ...
# 00007ff9`b3390000 00007ff9`b3be9000   SHELL32    (deferred)
# ...
Save and reopen formatted WinDbg output
Sometimes you may want to persist debugger output while preserving DML tags. This is achieved using the Save Window to File button in the Command ribbon tab. The resulting file uses a .dml extension; opening it in a text editor confirms that the markup remains intact.
To reload this output into a new WinDbg command window, use the .dml_start command:
.dml_start C:\temp\test.dml
Windows Performance Recorder (WPR)
Profiles
As its name suggests, WPR is a tool that records ETW traces and is available on all modern Windowses. It is straightforward to use and provides a big number of ready-to-use tracing profiles. We can list them with the -profiles command and show any profile details with the profiledetails command, for example:
# list available profiles with their short description
wpr.exe -profiles

# ...
# GeneralProfile              First level triage
#         CPU                         CPU usage
#         DiskIO                      Disk I/O activity
#         FileIO                      File I/O activity
#         ...

# show profile details
wpr.exe -profiledetails CPU

# ...
# Profile                 : CPU.Verbose.Memory
#
# Collector Name          : WPR_initiated_WprApp_WPR System Collector
# Buffer Size (KB)        : 1024
# Number of Buffers       : 3258
# Providers
# System Keywords
#         CpuConfig
#         CSwitch
#         ...
#         SampledProfile
#         ThreadPriority
# System Stacks
#         CSwitch
#         ReadyThread
#         SampledProfile
#
# Collector Name          : WPR_initiated_WprApp_WPR Event Collector
# Buffer Size (KB)        : 1024
# Number of Buffers       : 20
# Providers
#         b7a19fcd-15ba-41ba-a3d7-dc352d5f79ba: : 0xff
#         e7ef96be-969f-414f-97d7-3ddb7b558ccc: 0x2000: 0xff
#         Microsoft-JScript: 0x1: 0xff
#         Microsoft-Windows-BrokerInfrastructure: 0x1: 0xff
#         Microsoft-Windows-DotNETRuntime: 0x20098: 0x05
#         ...
#         Microsoft-Windows-Win32k: 0x80000: 0xff
Profiles often come in two versions: verbose and light, and we decide which one to use by appending “Verbose” or “Light” to the main profile name (if we do not specify the version, WPR defaults to “Verbose”), for example:
wpr.exe -profiledetails CPU.Light
The trace could be memory- or file- based, with memory-based being the default. We can switch to the file-based profile by using the -filemode option. If we can find a profile for our tracing scenario, we may build a custom one (WPR profile schema is documented here). It is often easier to base it one of the existing profiles, which we may extract with the -exportprofile command, for example:
# export the memory-based CPU.Light profilek
wpr.exe -exportprofile CPU.Light C:\temp\CPU.light.wprp
# export the file-based CPU.Light profilek
wpr.exe -exportprofile CPU.Light C:\temp\CPU.light.wprp -filemode
Interestingly, in the XML file, profile names include also the tracing mode, so the memory-based profile will have name CPU.Light.Memory, as you can see in the example below:
<WindowsPerformanceRecorder Version="1.0">
  <Profiles>
    <!-- ... -->
    <Profile Id="CPU.Light.Memory" Name="CPU" Description="RunningProfile:CPU.Light.Memory" LoggingMode="Memory" DetailLevel="Light">
    <!-- or with the -filemode option -->
    <Profile Id="CPU.Light.File" Name="CPU" Description="RunningProfile:CPU.Light.File" LoggingMode="File" DetailLevel="Light">
  </Profiles>
</WindowsPerformanceRecorder>
An exteremly important parameter of the collector configuration are buffers. If we look into the exported profiles, we will find that the number of buffers differs depending on the mode which we use for tracing. Memory-based profiles will use a much higher number of buffers, for example:
<!-- CPU.Verbose.Memory -->
<SystemCollector Id="WPR_initiated_WprApp_WPR_System_Collector" Name="WPR_initiated_WprApp_WPR System Collector">
  <BufferSize Value="1024" />
  <Buffers Value="1023" />
</SystemCollector>

<!-- CPU.Verbose.File -->
<SystemCollector Id="WPR_initiated_WprApp_WPR_System_Collector" Name="WPR_initiated_WprApp_WPR System Collector">
  <BufferSize Value="1024" />
  <Buffers Value="20" />
</SystemCollector>
The number of buffers depends also on the amount of memory on the host. Because BufferSize specifies memory size in KB, the above space is quite large (1GB). In memory mode, we operate on circular in-memory buffers - the system adds new buffers when the previous buffers fill up. When it reaches the maximum, it begins to overwrite events in the oldest buffers. For a file-based traces, the number of buffers is much smaller, as we only need to ensure that we are not dropping events because the disk cannot keep up with the write operations.
Apart from keywords and levels, we may filter the trace and stack events by the event IDs (EventFilters, StackFilters). Filtering by process name is also possible, however, in my tests I found that the ProcessExeFilter works only for processes already running when we start the trace:
<EventProvider Id="DotNetRuntime" Name="e13c0d23-ccbc-4e12-931b-d9cc2eee27e4" ProcessExeFilter="filecopy.exe">
  <Keywords>
    <Keyword Value="0x60098" />
  </Keywords>
</EventProvider>
<Profile Id="Wtrace.Verbose.Memory" Name="Wtrace" LoggingMode="Memory" DetailLevel="Verbose" Description="wtrace trace in memory profile">
  <Collectors>
    <EventCollectorId Value="wtrace-user">
      <EventProviders>
        <EventProviderId Value="DotNetRuntime" />
      </EventProviders>
    </EventCollectorId>
  </Collectors>
</Profile>
Working with WPR profiles is described in details in a great series of posts on Microsoft’s Performance and Diagnostics blog and I highly recommend reading them:
- WPR Start and Stop Commands
- Authoring custom profiles – Part 1
- Authoring Custom Profiles – Part 2
- Authoring Custom Profiles – Part 3
I also created an EtwMetadata.ps1 script that you may use to decode the wprp files. For example:
wpr.exe -exportprofile CPU.Light C:\temp\CPU.light.wprp

curl.exe -o C:\temp\EtwMetadata.ps1 https://wtrace.net/assets/other/EtwMetadata.ps1.txt

. C:\temp\EtwMetadata.ps1
# Initializing ETW providers metadata...

Get-EtwProvidersFromWprProfile C:\temp\CPU.light.wprp

# WARNING: No metadata found for provider 'b7a19fcd-15ba-41ba-a3d7-dc352d5f79ba'
# WARNING: No metadata found for provider 'e7ef96be-969f-414f-97d7-3ddb7b558ccc'
# Id                                   Name                                           Keywords
# --                                   ----                                           --------
# 36b6f488-aad7-48c2-afe3-d4ec2c8b46fa Microsoft-Windows-Performance-Recorder-Control @{Name=PerfStatus; Value=65536}
# b675ec37-bdb6-4648-bc92-f3fdc74d3ca2 Microsoft-Windows-Kernel-EventTracing          @{Name=ETW_KEYWORD_LOST_EVENT; Val…
# 83ed54f0-4d48-4e45-b16e-726ffd1fa4af Microsoft-Windows-Networking-Correlation       {@{Name=ActivityTransfer; Value=1}…
# d8975f88-7ddb-4ed0-91bf-3adf48c48e0c Microsoft-Windows-RPCSS                        {@{Name=EpmapDebug; Value=256}, @{…
# 6ad52b32-d609-4be9-ae07-ce8dae937e39 Microsoft-Windows-RPC
# d49918cf-9489-4bf1-9d7b-014d864cf71f Microsoft-Windows-ProcessStateManager          {@{Name=StateChange; Value=1}, @{N…
# e6835967-e0d2-41fb-bcec-58387404e25a Microsoft-Windows-BrokerInfrastructure         @{Name=BackgroundTask; Value=1}
Starting and stopping the trace
After picking a profile or profiles that we want to use, we can start a tracing session with the -start command. Some examples:
# starts verbose CPU profile
wpr.exe -start CPU.verbose
# same as above
wpr.exe -start CPU

# starts light CPU profile
wpr.exe -start CPU.light

# multiple profiles start
wpr.exe -start CPU -start VirtualAllocation -start Network

# starts a custom WPRTest.Verbose profile defined in the C:\temp\CustomProfile.wprp file
wpr.exe -start "C:\temp\CustomProfile.wprp!WPRTest" -filemode
# starts a custom WPRTest.Light profile defined in the C:\temp\CustomProfile.wprp file
wpr.exe -start "C:\temp\CustomProfile.wprp!WPRTest.Light"
There could be only one WPR trace running in the system and we can check its status using the -status command:
 wpr -status

# Microsoft Windows Performance Recorder Version 10.0.26100 (CoreSystem)
# Copyright (c) 2024 Microsoft Corporation. All rights reserved.
#
# WPR recording is in progress...
#
# Time since start        : 00:00:01
# Dropped event           : 0
# Logging mode            : File
To terminate the trace we may use either the -stop or the -cancel command:
# stopping the trace and saving it to a file with an optional description
wpr.exe -stop "C:\temp\testapp-fail.etl" "Abnormal termination of testapp.exe"
# cancelling the trace (no trace files will be created)
wpr.exe -cancel
Issues
Error 0x80010106
If it happens when you run the -stop command, use wpr.exe from Windows SDK, build 1950 or later.
Error 0xc5580612
If you are using ProcessExeFilter in your profile, this error may indicate that a process with a given name is not running when the trace starts (it is thrown by WindowsPerformanceRecorderControl!WindowsPerformanceRecorder::CControlManager::VerifyAllProvidersEnabled):
An Event session cannot be started without any providers.

Profile Id: Wtrace.Verbose.File

Error code: 0xc5580612

An Event session cannot be started without any providers.
Windows Performance Analyzer (WPA)
Installation
Windows Performance Analyzer (wpa.exe), may be installed from Microsoft Store (recommended) or as part of the Windows Performance Toolkit, included in the Windows SDK.
Tips on analyzing events
In CPU Wait analysis, each row marks a moment, when a thread received CPU time (MS docs) after, for example, waiting on an event object. The Readying Thread is the thread that woke up the New Thread. And the Old Thread is the thread which gave place on a CPU to the New Thread. The diagram below from Microsoft documentation nicely explain those terms:
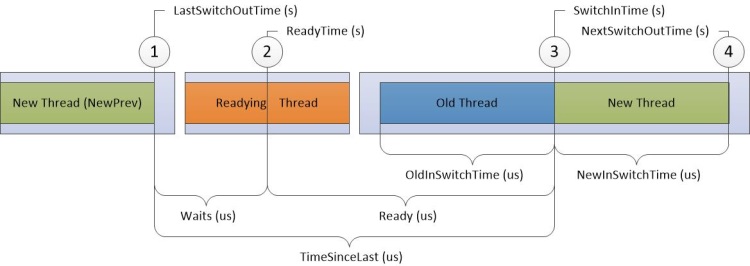
Here is an example view of my test GUI app when I call the Sleep function after pressing a button:
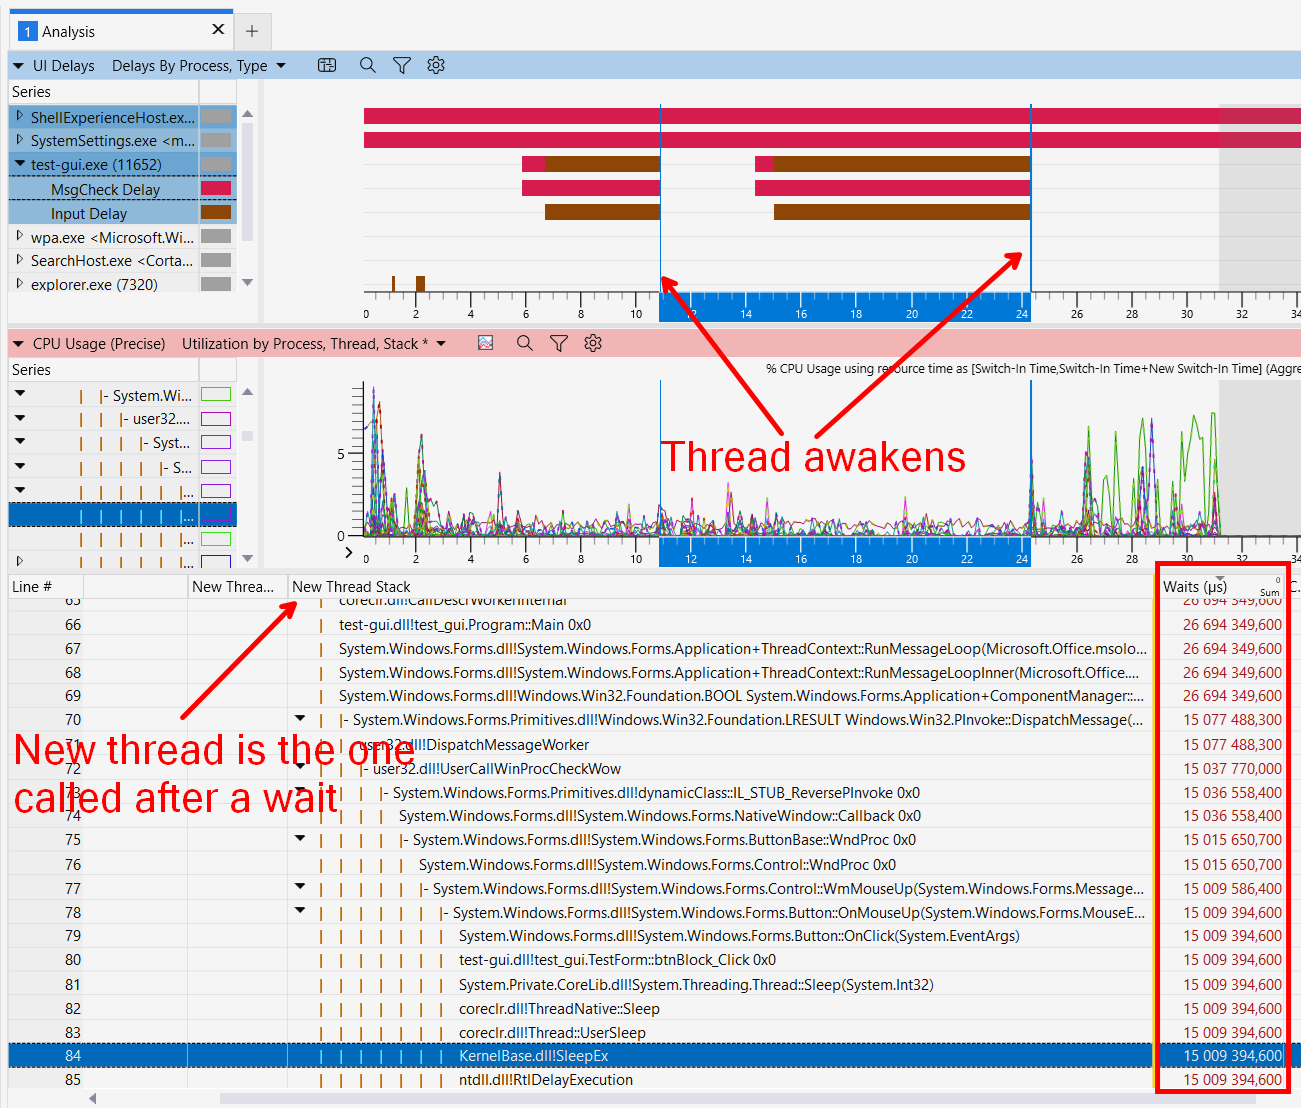
As you can see, the Wait column shows the time spent on waiting, while the UI view shows the time when the application was unresponsive.
WPA allows us to group the call stacks by tags. The default stacktag list can be found in the c:\Program Files (x86)\Windows Kits\10\Windows Performance Toolkit\Catalog\default.stacktags file.
We may also extend WPA with our own plugins. The SDK repository contains sample extensions. Wpa.Demystifier is another interesting extension to check.
Perfview
Installation
Could be downloaded from its release page or installed with winget:
winget install --id Microsoft.PerfView
Tips on recording events
Most often you will use the Collect dialog, but it is also possible to use PerfView from a command line. An example command collecting traces into a 500MB file (in circular mode) may look as follows:
perfview -AcceptEULA -ThreadTime -CircularMB:500 -Circular:1 -LogFile:perf.output -Merge:TRUE -Zip:TRUE -noView collect
A new console window will open with the following text:
Pre V4.0 .NET Rundown enabled, Type 'D' to disable and speed up .NET Rundown.
Do NOT close this console window.   It will leave collection on!
Type S to stop collection, 'A' will abort.  (Also consider /MaxCollectSec:N)

Type 'S' when you are done with tracing and wait (DO NOT CLOSE THE WINDOW) till you see `Press enter to close window`. Then copy the files: PerfViewData.etl.zip and perf.output to the machine when you will perform analysis.
If you are also interested in the network traces append the -NetMonCapture option. This will generate an additional PerfViewData_netmon.cab file.
If we use the EventSource provider and want to collect the call stacks along with the events, we need to append @StacksEnabled=true to the provider name, for example: *EFTrace:@StacksEnabled=true.
Tips on analyzing events
Select a time range and press Alt+R to set it for the grid. We may also copy a range, paste it in the Start box and then press Enter to apply it (PerfView should fill the End box).
The table below contains grouping patterns I use for various analysis targets
| Name | Pattern |
|---|---|
| Just my code with folded threads | [My app + folded threads] \Temporary ASP.NET Files\->;!dynamicClass.S->;!=>OTHER;Thread->AllThreads |
| Just my code with folded threads (ASP.NET view) | [My app + folded threads and ASP.NET requests] Thread -> AllThreads;Request ID * URL: {*}-> URL $1;\Temporary ASP.NET Files\->;!dynamicClass.S->;!=>OTHER |
| Just my code with folded threads (Server requests view) | [My app + folded threads and requests] Thread -> AllThreads;ASP.NET Request: * URL: {*}-> URL $1;\Temporary ASP.NET Files\->;!dynamicClass.S->;!=>OTHER |
| Group requests | ^Request ID->ALL Requests |
| Group requests by URL | Request ID * URL:{*}->$1 |
| Group async calls (by Christophe Nasarre) | {%}!{%}+<>c__DisplayClass*+<<{%}>b__*>d.MoveNext()->($1) $2 async $3 |
When exporting to Excel, the data coming from PerfView often does not have valid formatting and contains some strange characters at the beginning or at the end, for example:
0000 A0 A0 32 32 34 224
We may clean up those values by using the SUBSTITUTE function, for example:
=SUBSTITUTE(A1,LEFT(A1,1),"")
=SUBSTITUTE(A1,RIGHT(A1,1),"")
And later do the usual Copy, Paste as Values operation. Alternatively, we may copy the values column by column. In that case, PerfView won’t insert those special characters.
If we want to open a trace created by PerfView in WPA, we need to first convert it, for example:
perfview /wpr unzip test.etl.zip
# The above command should create two files (.etl and .etl.ngenpdb)
# and we can open wpa
wpa test.etl
Live view of events
The Listen user command enables a live view dump of events in the PerfView log:
PerfView.exe UserCommand Listen Microsoft-JScript:0x7:Verbose

# inspired by Konrad Kokosa's tweet
PerfView.exe UserCommand Listen Microsoft-Windows-DotNETRuntime:0x1:Verbose:@EventIDsToEnable="1 2"
Issues
Error 0x800700B7
[Kernel Log: C:\tools\PerfViewData.kernel.etl]
    Kernel keywords enabled: Default
    Aborting tracing for sessions 'NT Kernel Logger' and 'PerfViewSession'.
    Insuring .NET Allocation profiler not installed.
    Completed: Collecting data C:\tools\PerfViewData.etl   (Elapsed Time: 0,858 sec)
    Exception Occured: System.Runtime.InteropServices.COMException (0x800700B7): Cannot create a file when that file already exists. (Exception from HRESULT: 0x800700B7)
       at System.Runtime.InteropServices.Marshal.ThrowExceptionForHRInternal(Int32 errorCode, IntPtr errorInfo)
       at Microsoft.Diagnostics.Tracing.Session.TraceEventSession.EnableKernelProvider(Keywords flags, Keywords stackCapture)
       at PerfView.CommandProcessor.Start(CommandLineArgs parsedArgs)
       at PerfView.CommandProcessor.Collect(CommandLineArgs parsedArgs)
       at PerfView.MainWindow.c__DisplayClass9.b__7()
       at PerfView.StatusBar.c__DisplayClass8.b__6(Object param0)
    An exceptional condition occurred, see log for details.
If you receive such error, make sure that no kernel log is running with perfview listsessions and eventually kill it with perfview abort.
logman
Nowadays, logman will not be our first choice tool to collect ETW trace, but the best thing about it is that it is a built-in tool and has been available in Windows for many years already, so might be the only option if you need to work on a legacy Windows system.
Querying providers installed in the system
Logman is great for querying ETW providers installed in the system or activated in a given process:
# list all providers in the system
logman query providers

# show details about the ".NET Common Language Runtime" provider
logman query providers ".NET Common Language Runtime"

# list providers active in a process with ID 808
logman query providers -pid 808
Starting and stopping the trace
The following commands start and stop a tracing session that is using one provider:
logman start mysession -p {9744AD71-6D44-4462-8694-46BD49FC7C0C} -o "c:\temp\test.etl" -ets & timeout -1 & logman stop mysession -ets
For the provider options you may additionally specify the keywords (flags) and levels that will be logged: -p provider [flags [level]]
You may also use a file with a list of providers:
logman start mysession -pf providers.guids -o c:\temp\test.etl -ets & timeout -1 & logman stop mysession -ets
And the providers.guids file content is built of lines following the format: {guid} [flags] [level] [provider name] (flags, level, and provider name are optional), for example:
{AFF081FE-0247-4275-9C4E-021F3DC1DA35} 0xf    5  ASP.NET Events
{3A2A4E84-4C21-4981-AE10-3FDA0D9B0F83} 0x1ffe 5  IIS: WWW Server
If you want to record events from the kernel provider you need to name the session: NT Kernel Logger, for example:
logman start "NT Kernel Logger" -p "Windows Kernel Trace" "(process,thread,file,fileio,net)" -o c:\kernel.etl -ets & timeout -1 & logman stop "NT Kernel Logger" -ets
To see the available kernel provider keywords, run:
logman query providers "Windows Kernel Trace"

# Provider                                 GUID
# -------------------------------------------------------------------------------
# Windows Kernel Trace                     {9E814AAD-3204-11D2-9A82-006008A86939}
#
# Value               Keyword              Description
# -------------------------------------------------------------------------------
# 0x0000000000000001  process              Process creations/deletions
# 0x0000000000000002  thread               Thread creations/deletions
# ...
Additionally, we may change the way how events are saved to the file using the -mode parameter. For example, to use a circular file with maximum size of 200MB, we can run the following command:
logman start "NT Kernel Logger" -p "Windows Kernel Trace" "(process,thread,img)" -o C:\ntlm-kernel.etl -mode circular -max 200 -ets
wevtutil
Wevtutil is a built-in tool that allows us to manage manifest-based providers (publishers) installed in our system. Example usages:
# list all installed publishers
wevtutil ep
# find MSMQ publishers
wevtutil ep | findstr /i msmq

# extract details about a Microsoft-Windows-MSMQ publisher
wevtutil gp Microsoft-Windows-MSMQ /ge /gm /f:xml
tracerpt
Tracerpt is another built-in tool. It may collect ETW traces, but I usually use it only to convert etl files from binary to text format. Example commands:
# convert etl file to evtx
tracerpt -of EVTX test.etl -o test.evtx -summary test-summary.xml

# dump events to an XML file
tracerpt test.etl -o test.xml -summary test-summary.xml

# dump events to a HTML file
tracerpt.exe '.\NT Kernel Logger.etl' -o -report -f html
xperf
For a long time xperf was the best tool to collect ETW traces, providing ways to configure many aspects of the tracing sessions. It is now considered legacy (with wpr being its replacement), but many people still find its command line syntax eaier to use than WPR profiles. Here are some usage examples:
# list available Kernel Flags
xperf -providers KF
#       PROC_THREAD         : Process and Thread create/delete
#       LOADER              : Kernel and user mode Image Load/Unload events
#       PROFILE             : CPU Sample profile
#       CSWITCH             : Context Switch
#       ...

# list available Kernel Groups
xperf -providers KG
#       Base           : PROC_THREAD+LOADER+DISK_IO+HARD_FAULTS+PROFILE+MEMINFO+MEMINFO_WS
#       Diag           : PROC_THREAD+LOADER+DISK_IO+HARD_FAULTS+DPC+INTERRUPT+CSWITCH+PERF_COUNTER+COMPACT_CSWITCH
#       DiagEasy       : PROC_THREAD+LOADER+DISK_IO+HARD_FAULTS+DPC+INTERRUPT+CSWITCH+PERF_COUNTER
#       ...

# list installed providers
xperf -providers I
#       0063715b-eeda-4007-9429-ad526f62696e                              : Microsoft-Windows-Services
#       0075e1ab-e1d1-5d1f-35f5-da36fb4f41b1                              : Microsoft-Windows-Network-ExecutionContext
#       00b7e1df-b469-4c69-9c41-53a6576e3dad                              : Microsoft-Windows-Security-IdentityStore
#       01090065-b467-4503-9b28-533766761087                              : Microsoft-Windows-ParentalControls
#       ...

# start the kernel trace, enabling flags defined in the DiagEasy group
xperf -on DiagEasy
# stop the kernel trace
xperf -stop -d "c:\temp\DiagEasy.etl"

# start the kernel with some additional settings and wait for the user to stop it
xperf -on Latency -stackwalk Profile -buffersize 2048 -MaxFile 1024 -FileMode Circular && timeout -1 && xperf stop -d "C:\highCPUUsage.etl"

# in user-mode tracing you may still use kernel flags and groups but for each user-trace provider
# you need to add some additional parameters: -on (GUID|KnownProviderName)[:Flags[:Level[:0xnnnnnnnn|'stack|[,]sid|[,]tsid']]]
xperf -start ClrRundownSession -on ClrAll:0x118:5+a669021c-c450-4609-a035-5af59af4df18:0x118:5 -f clr_DCend.etl -buffersize 128 -minbuffers 256 -maxbuffers 512
timeout /t 15
xperf -stop ClrSession ClrRundownSession -stop -d cpu_clr.etl

# dump collected events to a text file
xperf -i test.etl -o test.csv
Chad Schultz published many xperf scripts in the WindowsPerformance repository, so check them out if you are interested in using xperf.
TSS (TroubleShootingScript toolset)
TSS contains tons of various scripts and ETW is only a part of it. TSS official documentation is here and we can download the package from https://aka.ms/getTSS.
Here is an example PowerShell script to install and run the main script:
powershell.exe -NoProfile -ExecutionPolicy RemoteSigned -Command "Invoke-WebRequest -Uri https://aka.ms/getTSS -OutFile $env:TEMP\TSS.zip; Unblock-File $env:TEMP\TSS.zip; Expand-Archive -Force -LiteralPath $env:TEMP\TSS.zip -DestinationPath C:\TSS; Remove-Item $env:TEMP\TSS.zip; C:\TSS\TSS.ps1 -ListSupportedTrace"
TSS defined many troubleshooting scenarios with precompiled parameters:
C:\tSS\TSS.ps1 -ListSupportedScenarioTrace
# ...
# NET_General        - collects CommonTask NET, NetshScenario InternetClient_dbg, Procmon, PSR, Video, SDP NET, xray, CollectComponentLog
# ...
where:
CommonTaskare commands run before and after the scenario (onlyNETin this case)NetshScenariois the selected netsh scenario (InternetClient_dbg)Procmonwill start procmonPSRwill run step recorderVideowill record a video of what the user is doingSDP(Support Diagnostic Package) andNETenableGeneral,SMB, andNETcountersxrayruns xray scripts to discover existing problemsCollectComponentLogcollects logs of commands run in a given scenario
To start a scenario, we run:
C:\TSS\TSS.ps1 -Scenario NET_General
We may also manually “compose” the TSS command. A nice GUI tool for this purpose is .\TSSGUI.ps1 (start it from the TSS folder). We may also list available TSS features:
C:\TSS\TSS.ps1 -ListSupportedCommands
C:\TSS\TSS.ps1 -ListSupportedControls
C:\TSS\TSS.ps1 -ListSupportedDiag
C:\TSS\TSS.ps1 -ListSupportedLog
C:\TSS\TSS.ps1 -ListSupportedNetshScenario
C:\TSS\TSS.ps1 -ListSupportedNoOptions
C:\TSS\TSS.ps1 -ListSupportedPerfCounters
C:\TSS\TSS.ps1 -ListSupportedScenarioTrace
C:\TSS\TSS.ps1 -ListSupportedSDP
C:\TSS\TSS.ps1 -ListSupportedSetOptions
C:\TSS\TSS.ps1 -ListSupportedTrace
C:\TSS\TSS.ps1 -ListSupportedWPRScenario
C:\TSS\TSS.ps1 -ListSupportedXperfProfile
Example commands to check which ETW providers the NET_COM component is using:
.\TSS.ps1 -ListSupportedTrace | select-string "_COM"
# [Component]  -NET_COM                  COM/DCOM/WinRT/PRC component tracing. -EnableCOMDebug will enable further debug logging
# [Component]  -UEX_COM                  COM/DCOM/WinRT/PRC component ETW tracing. -EnableCOMDebug will enable further debug logging
# Usage:
#   .\TSS.ps1 -<ComponentName> -<ComponentName>
#   Example: .\TSS.ps1 -UEX_FSLogix -UEX_Logon

.\TSS -ListETWProviders NeT_COM

# List of 20 Provider GUIDs (Flags/Level) for ComponentName: NET_COM
# ==========================================================
# {9474a749-a98d-4f52-9f45-5b20247e4f01}
# {bda92ae8-9f11-4d49-ba1d-a4c2abca692e}
# ...
The TSS commands create raports in the C:\MS_DATA folder.
To collect the trace in the background we may use the -StartNoWait option and -Stop to stop the trace.
If we add the -StartAutoLogger option, our trace will start when the system boots. We stop by calling TSS.ps1 -Stop, as usual.
Example commands:
# starting WPR using TSS
C:\TSS\TSS.ps1 -WPR CPU -WPROptions "-start Dotnet -start DesktopComposition"

# Starting time travel debugging session using TSS
# 1234 is the process PID (we may use process name as well, for example winver.exe)
C:\TSS\TSS.ps1 -AcceptEula -TTD 1234
MSO scripts (PowerShell)
MSO-Scripts repository hosts many interesting PowerShell scripts for working with ETW traces.
Performance Counters
General information
The Performance Counter selection uses following syntax: \\Computer\PerfObject(ParentInstance/ObjectInstance#InstanceIndex)\Counter.
In order to match the process instance index with a PID you may use a special counter \Process(*)\ID Process. Similar counter (\.NET CLR Memory(*)\Process ID) exists for .NET Framework apps. If we want to track performance data for a particular process, we should start with collecting data from those two counters, for example:
typeperf -c "\Process(*)\ID Process" -si 1 -sc 1 -f CSV -o pids.txt
typeperf -c "\.NET CLR Memory(*)\Process ID" -si 1 -sc 1 -f CSV -o clr-pids.txt
An application that supports Performance Counters must have a Performance key under the HKLM\SYSTEM\CurrentControlSet\Services\appname key. The following example shows the values that you must include for this key.
HKEY_LOCAL_MACHINE
   \SYSTEM
      \CurrentControlSet
         \Services
            \application-name
               \Linkage
                  Export = a REG_MULTI_SZ value that will be passed to the `OpenPerformanceData` function
               \Performance
                  Library = Name of your performance DLL
                  Open = Name of your Open function in your DLL
                  Collect = Name of your Collect function in your DLL
                  Close = Name of your Close function in your DLL
                  Open Timeout = Timeout when waiting for the `OpenPerformanceData` to finish
                  Collect Timeout = Timeout when waiting for the `CollectPerformanceData` to finish
                  Disable Performance Counters = A value added by system if something is wrong with the library
The Performance Counter names and descriptions are stored under the HKLM\SOFTWARE\Microsoft\Windows NT\CurrentVersion\Perflib key in the registry.
HKEY_LOCAL_MACHINE
   \SOFTWARE
      \Microsoft
         \Windows NT
            \CurrentVersion
               \Perflib
                  Last Counter = highest counter index
                  Last Help = highest help index
                  \009
                     Counters = 2 System 4 Memory...
                     Help = 3 The System Object Type...
                  \supported language, other than English
                     Counters = ...
                     Help = ...
Listing Performance Counters installed in the system
To list the available Performance Counters we may use the Get-Counter cmdlet in PowerShell or the typeperf command.
For example, below, we look for Performance Counters in the processor set:
PS> Get-Counter -listset processor

CounterSetName     : Processor
MachineName        : .
CounterSetType     : MultiInstance
Description        : The Processor performance object consists of counters that measure aspects of processor activity.
                     The processor is the part of the computer that performs arithmetic and logical computations, initi
                     ates operations on peripherals, and runs the threads of processes.  A computer can have multiple p
                     rocessors.  The processor object represents each processor as an instance of the object.
Paths              : {\Processor(*)\% Processor Time, \Processor(*)\% User Time, \Processor(*)\% Privileged Time, \Proc
                     essor(*)\Interrupts/sec...}
PathsWithInstances : {\Processor(0)\% Processor Time, \Processor(1)\% Processor Time, \Processor(_Total)\% Processor Ti
                     me, \Processor(0)\% User Time...}
Counter            : {\Processor(*)\% Processor Time, \Processor(*)\% User Time, \Processor(*)\% Privileged Time, \Proc
                     essor(*)\Interrupts/sec...}
The Get-Counter cmdlet accepts also wildcards and is case insensitive so to list Performance Counter sets which starts with .net you may issue command: Get-Counter -listset .net*.
To find all Performance Counters for the .NET CLR Memory object using typeperf, we could run:
> typeperf -q ".NET CLR Memory"
\.NET CLR Memory(*)\# Gen 0 Collections
\.NET CLR Memory(*)\# Gen 1 Collections
...
If we also want to include instance information:
> typeperf -qx ".NET CLR Memory"
\.NET CLR Memory(_Global_)\# Gen 0 Collections
\.NET CLR Memory(powershell)\# Gen 0 Collections
\.NET CLR Memory(powershell#1)\# Gen 0 Collections
\.NET CLR Memory(_Global_)\# Gen 1 Collections
\.NET CLR Memory(powershell)\# Gen 1 Collections
...
Finally, the lodctr extracts Performance Counters information from the registry:
> lodctr /q:".NET CLR Data"
Performance Counter ID Queries [PERFLIB]:
    Base Index: 0x00000737 (1847)
    Last Counter Text ID: 0x0000435A (17242)
    Last Help Text ID: 0x0000435B (17243)

[.NET CLR Data] Performance Counters (Enabled)
    DLL Name: netfxperf.dll
    Open Procedure: OpenPerformanceData
    Collect Procedure: CollectPerformanceData
    Close Procedure: ClosePerformanceData
    First Counter ID: 0x000013A4 (5028)
    Last Counter ID: 0x000013B0 (5040)
    First Help ID: 0x000013A5 (5029)
    Last Help ID: 0x000013B1 (5041)
Collecting performance data
We could use the same tools we used for querying also to collect Performance Counters data. In PowerShell, to collect 50 samples (with 1s interval) from all the process counters and save them to a binary file we could run the following set of commands:
(Cet-Counter -listset process).Paths > counters.txt
Get-Counter (gc .\counters.txt) -sampleinterval 1 -maxsamples 20 | Export-Counter testdata.blg -FileFormat BLG  -Force
Another example shows how to collect samples with interval 2s until ctrl-c is pressed:
Get-Counter (gc .\counters.txt) -sampleinterval 2 -continuous /
We may achieve the same results with typeperf, for example:
typeperf -cf .\counters.txt -si 1 -o testdata.blg -f BIN -sc 20
typeperf -cf .\counters.txt -si 1
Of course, with both PowerShell or typeperf, we may also retrieve only one counter data:
typeperf -c "\process(*)\% Processor Time" -si 1 -sc 20 -o testdata.blg -f BIN
Finally, we have a gui tool, perfmon that allows us to pick the interesting counters and present their values in a graph. We may also trigger a scheduled task when a specific counter threshold is met. You just need to manually create a User-Created Data Collector of type Performance Counter Alert. You will then be able select which counter values are interesting for you.
Examining the collected performance data
Using system tools
If we saved the counters data to a binary file, we can open it with perfmon:
perfmon /sys /open "c:\temp\testdata.blg"
REMARK: Remember to specify full path to the binary file.
A command line tool to query the collected performance data is relog. For example, to list the Performance Counters available in the input file, run the following command:
relog -q testdata.blg
In PowerShell, the Import-Counter cmdlet reads performance data generated by any Performance Counter tool and converts it to the performance data objects (the same as generated by the Get-Counter command).
Collect Performance Counter binary data and convert it using the Import-Counter cmdlet:
typeperf -cf .\counters.txt -si 1 -o testdata.blg -f BIN -sc 20
Import-Counter .\testdata.blg
The Import-Counter cmdlet may show statistics for the performance data file, for example:
PS C:\temp> Import-Counter .\testdata.blg -summary

OldestRecord                   NewestRecord                   SampleCount
------------                   ------------                   -----------
2012-03-31 15:54:27            2012-03-31 15:54:46            20
Using Log Parser
Log Parser Studio and the command line logparser tool (and library) are great data analysing tools and we may use them to query Performance Counters data as well. They do not understand the BLG format so before we can look into the data we need to convert the BLG file to CSV format (additional filtering is possible):
relog -f CSV testdata.blg -o testdata.csv
And we are ready to use logparser to parse the data, for example:
logparser "select * from testdata.csv" -o:DATAGRID

logparser "select top 2 [Event Name], Type, [User Data] into c:\temp\test.csv from dumpfile.csv"
To draw a chart presenting the Performance Counters data use the following syntax:
logparser "select [time], [\\pecet\process(system)\% user time],[\\pecet\process(_total)\% user time] into test.gif from testdata.csv" -o:CHART

logparser "select to_timestamp(time, 'MM/dd/yyyy HH:mm:ss.ll'), [\\pecet\process(system)\% user time],[\\pecet\process(_total)\% user time] into test.gif from testdata.csv" -o:CHART
Save performance data in SQL Server
To save Performance Counters data in SQL Server, you need to create a new Data Source (ODBC) using the SQL Server driver (SQLSRV32.dll). Then run the relog tool, for example:
> relog -f SQL -o SQL:Test!fd .\memperfdata-blog.csv

Input
----------------
File(s):
     .\memperfdata-blog.csv (CSV)

Begin:    2012-4-17 6:44:15
End:      2012-4-17 6:44:25
Samples:  10

100.00%

Output
----------------
File:     SQL:Test!fd

Begin:    2012-4-17 6:44:15
End:      2012-4-17 6:44:25
Samples:  4

The command completed successfully.
More information:
- Relog Syntax Examples (for SQL Server) http://www.resquel.com/ssb/2009/02/26/RelogSyntaxExamplesForSQLServer.aspx
- SQL Log File Schema http://msdn.microsoft.com/en-us/library/aa373198(v=vs.85).aspx
Fix problems with Performance Counters
Performance Counters sometimes might become corrupted - in such a case try to locate last Performance Counter data backup in C:\Windows\System32 folder. It should have a name similar to PerfStringBackup.ini. Before making any changes make backup of your current perf counters:
lodctr /S:PerfStringBackup_broken.ini
and then restore the counters:
lodctr /R:PerfStringBackup.ini