Event Tracing for Windows (ETW)
Table of contents:
- General information
- Tools
- Event types
- Libraries
General information
When loading symbols, the ETW tools and libraries use the _NT_SYMBOLS_PATH environment variable to download (and cache) the PDB files and _NT_SYMCACHE_PATH to store their preprocessed (cached) versions. An example machine configuration might look as follows:
setx /M _NT_SYMBOL_PATH "SRV*C:\symbols\dbg*https://msdl.microsoft.com/download/symbols"
setx /M _NT_SYMCACHE_PATH "C:\symcache"
On Windows 7 64-bit, to improve stack walking, disable paging of the drivers and kernel-mode system code:
reg add "HKLM\System\CurrentControlSet\Control\Session Manager\Memory Management" -v DisablePagingExecutive -d 0x1 -t REG\_DWORD -f
# or
wpr.exe -disablepagingexecutive`
For manifest-based providers set MatchAnyKeywords to 0x00 to receive all events. Otherwise you need to create a bitmask which will be or-ed with event keywords. Additionally when MatchAllKeywords is set, its value is used for events that passed the MatchAnyKeywords test and providers additional and filtering.
For classic providers set MatchAnyKeywords to 0xFFFFFFFF to receive all events.
Up to 8 sessions may collect manifest-based provider events, but only 1 session may be created for a classic provider (when a new session is created the provider switches to the session).
When creating a session we may also specify the minimal severity level for collected events, where 1 is the critical level and 5 the verbose level (all events are logged).
Tools
Windows Performance Recorder (WPR)
Profiles
As its name suggests, WPR is a tool that records ETW traces and is available on all modern Windowses. It is straightforward to use and provides a big number of ready-to-use tracing profiles. We can list them with the -profiles command and show any profile details with the profiledetails command, for example:
# list available profiles with their short description
wpr.exe -profiles

# ...
# GeneralProfile              First level triage
#         CPU                         CPU usage
#         DiskIO                      Disk I/O activity
#         FileIO                      File I/O activity
#         ...

# show profile details
wpr.exe -profiledetails CPU

# ...
# Profile                 : CPU.Verbose.Memory
#
# Collector Name          : WPR_initiated_WprApp_WPR System Collector
# Buffer Size (KB)        : 1024
# Number of Buffers       : 3258
# Providers
# System Keywords
#         CpuConfig
#         CSwitch
#         ...
#         SampledProfile
#         ThreadPriority
# System Stacks
#         CSwitch
#         ReadyThread
#         SampledProfile
#
# Collector Name          : WPR_initiated_WprApp_WPR Event Collector
# Buffer Size (KB)        : 1024
# Number of Buffers       : 20
# Providers
#         b7a19fcd-15ba-41ba-a3d7-dc352d5f79ba: : 0xff
#         e7ef96be-969f-414f-97d7-3ddb7b558ccc: 0x2000: 0xff
#         Microsoft-JScript: 0x1: 0xff
#         Microsoft-Windows-BrokerInfrastructure: 0x1: 0xff
#         Microsoft-Windows-DotNETRuntime: 0x20098: 0x05
#         ...
#         Microsoft-Windows-Win32k: 0x80000: 0xff
Profiles often come in two versions: verbose and light, and we decide which one to use by appending “Verbose” or “Light” to the main profile name (if we do not specify the version, WPR defaults to “Verbose”), for example:
wpr.exe -profiledetails CPU.Light
The trace could be memory- or file- based, with memory-based being the default. We can switch to the file-based profile by using the -filemode option. If we can find a profile for our tracing scenario, we may build a custom one (WPR profile schema is documented here). It is often easier to base it one of the existing profiles, which we may extract with the -exportprofile command, for example:
# export the memory-based CPU.Light profilek
wpr.exe -exportprofile CPU.Light C:\temp\CPU.light.wprp
# export the file-based CPU.Light profilek
wpr.exe -exportprofile CPU.Light C:\temp\CPU.light.wprp -filemode
Interestingly, in the XML file, profile names include also the tracing mode, so the memory-based profile will have name CPU.Light.Memory, as you can see in the example below:
<WindowsPerformanceRecorder Version="1.0">
  <Profiles>
    <!-- ... -->
    <Profile Id="CPU.Light.Memory" Name="CPU" Description="RunningProfile:CPU.Light.Memory" LoggingMode="Memory" DetailLevel="Light">
    <!-- or with the -filemode option -->
    <Profile Id="CPU.Light.File" Name="CPU" Description="RunningProfile:CPU.Light.File" LoggingMode="File" DetailLevel="Light">
  </Profiles>
</WindowsPerformanceRecorder>
An exteremly important parameter of the collector configuration are buffers. If we look into the exported profiles, we will find that the number of buffers differs depending on the mode which we use for tracing. Memory-based profiles will use a much higher number of buffers, for example:
<!-- CPU.Verbose.Memory -->
<SystemCollector Id="WPR_initiated_WprApp_WPR_System_Collector" Name="WPR_initiated_WprApp_WPR System Collector">
  <BufferSize Value="1024" />
  <Buffers Value="1023" />
</SystemCollector>

<!-- CPU.Verbose.File -->
<SystemCollector Id="WPR_initiated_WprApp_WPR_System_Collector" Name="WPR_initiated_WprApp_WPR System Collector">
  <BufferSize Value="1024" />
  <Buffers Value="20" />
</SystemCollector>
The number of buffers depends also on the amount of memory on the host. Because BufferSize specifies memory size in KB, the above space is quite large (1GB). In memory mode, we operate on circular in-memory buffers - the system adds new buffers when the previous buffers fill up. When it reaches the maximum, it begins to overwrite events in the oldest buffers. For a file-based traces, the number of buffers is much smaller, as we only need to ensure that we are not dropping events because the disk cannot keep up with the write operations.
Apart from keywords and levels, we may filter the trace and stack events by the event IDs (EventFilters, StackFilters). Filtering by process name is also possible, however, in my tests I found that the ProcessExeFilter works only for processes already running when we start the trace:
<EventProvider Id="DotNetRuntime" Name="e13c0d23-ccbc-4e12-931b-d9cc2eee27e4" ProcessExeFilter="filecopy.exe">
  <Keywords>
    <Keyword Value="0x60098" />
  </Keywords>
</EventProvider>
<Profile Id="Wtrace.Verbose.Memory" Name="Wtrace" LoggingMode="Memory" DetailLevel="Verbose" Description="wtrace trace in memory profile">
  <Collectors>
    <EventCollectorId Value="wtrace-user">
      <EventProviders>
        <EventProviderId Value="DotNetRuntime" />
      </EventProviders>
    </EventCollectorId>
  </Collectors>
</Profile>
Working with WPR profiles is described in details in a great series of posts on Microsoft’s Performance and Diagnostics blog and I highly recommend reading them:
- WPR Start and Stop Commands
- Authoring custom profiles – Part 1
- Authoring Custom Profiles – Part 2
- Authoring Custom Profiles – Part 3
I also created an EtwMetadata.ps1 script that you may use to decode the wprp files. For example:
wpr.exe -exportprofile CPU.Light C:\temp\CPU.light.wprp

curl.exe -o C:\temp\EtwMetadata.ps1 https://wtrace.net/assets/other/EtwMetadata.ps1.txt

. C:\temp\EtwMetadata.ps1
# Initializing ETW providers metadata...

Get-EtwProvidersFromWprProfile C:\temp\CPU.light.wprp

# WARNING: No metadata found for provider 'b7a19fcd-15ba-41ba-a3d7-dc352d5f79ba'
# WARNING: No metadata found for provider 'e7ef96be-969f-414f-97d7-3ddb7b558ccc'
# Id                                   Name                                           Keywords
# --                                   ----                                           --------
# 36b6f488-aad7-48c2-afe3-d4ec2c8b46fa Microsoft-Windows-Performance-Recorder-Control @{Name=PerfStatus; Value=65536}
# b675ec37-bdb6-4648-bc92-f3fdc74d3ca2 Microsoft-Windows-Kernel-EventTracing          @{Name=ETW_KEYWORD_LOST_EVENT; Val…
# 83ed54f0-4d48-4e45-b16e-726ffd1fa4af Microsoft-Windows-Networking-Correlation       {@{Name=ActivityTransfer; Value=1}…
# d8975f88-7ddb-4ed0-91bf-3adf48c48e0c Microsoft-Windows-RPCSS                        {@{Name=EpmapDebug; Value=256}, @{…
# 6ad52b32-d609-4be9-ae07-ce8dae937e39 Microsoft-Windows-RPC
# d49918cf-9489-4bf1-9d7b-014d864cf71f Microsoft-Windows-ProcessStateManager          {@{Name=StateChange; Value=1}, @{N…
# e6835967-e0d2-41fb-bcec-58387404e25a Microsoft-Windows-BrokerInfrastructure         @{Name=BackgroundTask; Value=1}
Starting and stopping the trace
After picking a profile or profiles that we want to use, we can start a tracing session with the -start command. Some examples:
# starts verbose CPU profile
wpr.exe -start CPU.verbose
# same as above
wpr.exe -start CPU

# starts light CPU profile
wpr.exe -start CPU.light

# multiple profiles start
wpr.exe -start CPU -start VirtualAllocation -start Network

# starts a custom WPRTest.Verbose profile defined in the C:\temp\CustomProfile.wprp file
wpr.exe -start "C:\temp\CustomProfile.wprp!WPRTest" -filemode
# starts a custom WPRTest.Light profile defined in the C:\temp\CustomProfile.wprp file
wpr.exe -start "C:\temp\CustomProfile.wprp!WPRTest.Light"
There could be only one WPR trace running in the system and we can check its status using the -status command:
 wpr -status

# Microsoft Windows Performance Recorder Version 10.0.26100 (CoreSystem)
# Copyright (c) 2024 Microsoft Corporation. All rights reserved.
#
# WPR recording is in progress...
#
# Time since start        : 00:00:01
# Dropped event           : 0
# Logging mode            : File
To terminate the trace we may use either the -stop or the -cancel command:
# stopping the trace and saving it to a file with an optional description
wpr.exe -stop "C:\temp\testapp-fail.etl" "Abnormal termination of testapp.exe"
# cancelling the trace (no trace files will be created)
wpr.exe -cancel
Issues
Error 0x80010106 (RPC_E_CHANGED_MODE)
If it happens when you run the -stop command, use wpr.exe from Windows SDK, build 1950 or later.
Error 0xc5580612
If you are using ProcessExeFilter in your profile, this error may indicate that a process with a given name is not running when the trace starts (it is thrown by WindowsPerformanceRecorderControl!WindowsPerformanceRecorder::CControlManager::VerifyAllProvidersEnabled):
An Event session cannot be started without any providers.

Profile Id: Wtrace.Verbose.File

Error code: 0xc5580612

An Event session cannot be started without any providers.
Windows Performance Analyzer (WPA)
Installation
Windows Performance Analyzer (wpa.exe), may be installed from Microsoft Store (recommended) or as part of the Windows Performance Toolkit, included in the Windows SDK.
Tips on analyzing events
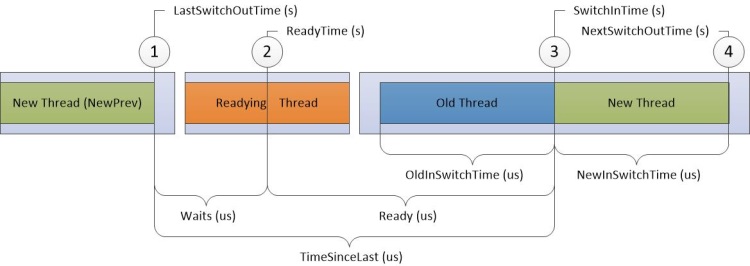
In CPU Wait analysis, each row marks a moment, when a thread received CPU time (MS docs) after, for example, waiting on an event object. The Readying Thread is the thread that woke up the New Thread. And the Old Thread is the thread which gave place on a CPU to the New Thread. The diagram below from Microsoft documentation nicely explain those terms:
Here is an example view of my test GUI app when I call the Sleep function after pressing a button:
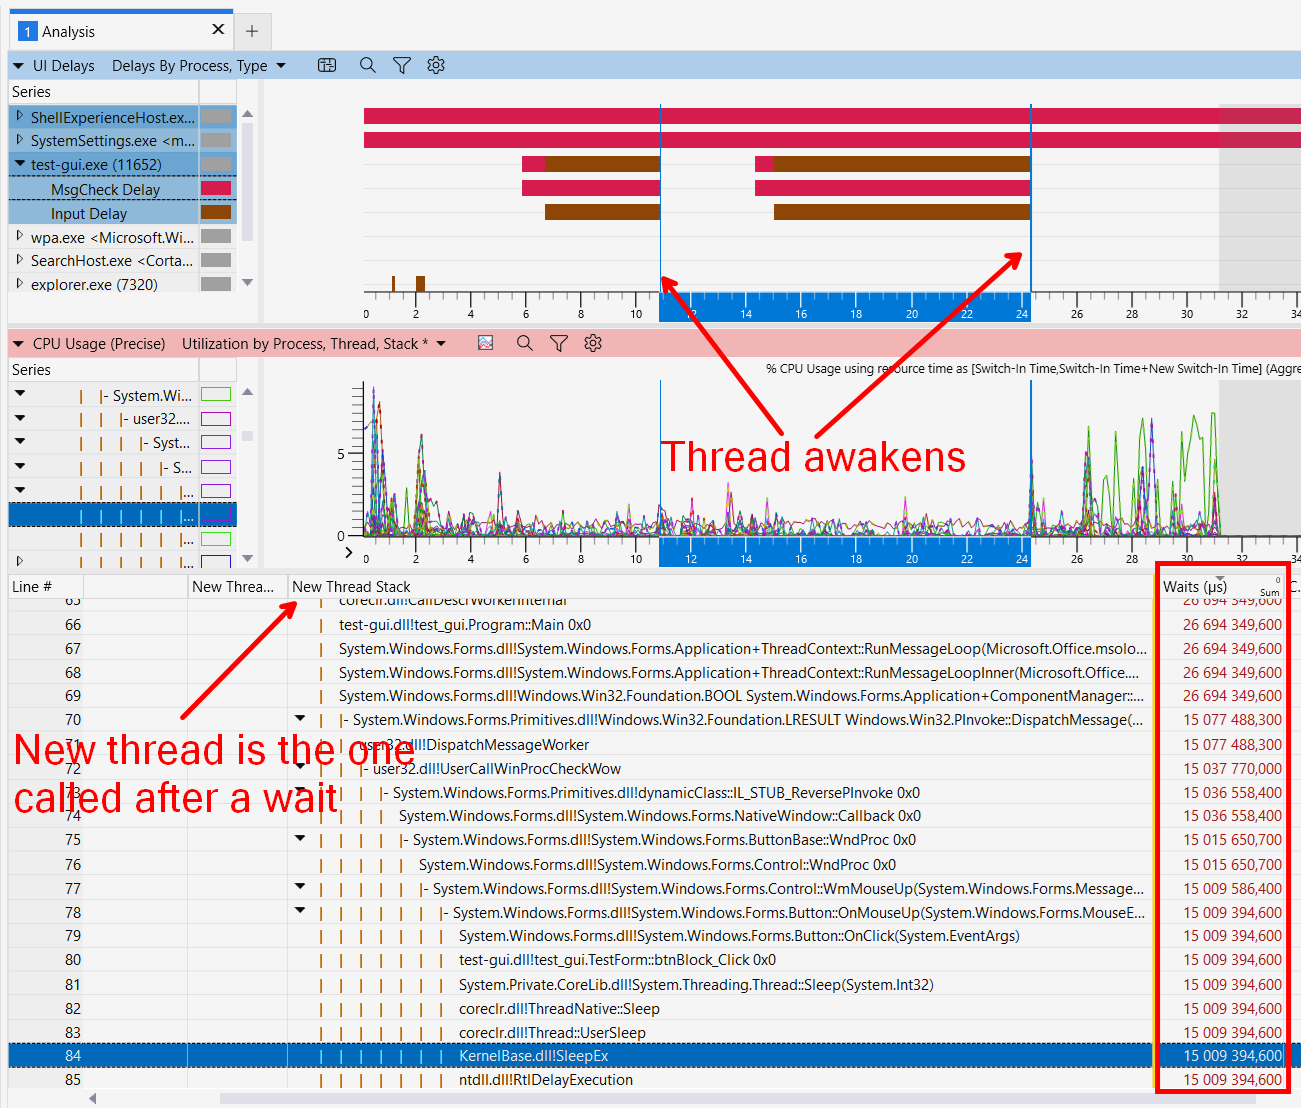
As you can see, the Wait column shows the time spent on waiting, while the UI view shows the time when the application was unresponsive.
WPA allows us to group the call stacks by tags. The default stacktag list can be found in the c:\Program Files (x86)\Windows Kits\10\Windows Performance Toolkit\Catalog\default.stacktags file.
We may also extend WPA with our own plugins. The SDK repository contains sample extensions. Wpa.Demystifier is another interesting extension to check.
Perfview
Installation
Could be downloaded from its release page or installed with winget:
winget install --id Microsoft.PerfView
Tips on recording events
Most often you will use the Collect dialog, but it is also possible to use PerfView from a command line. An example command collecting traces into a 500MB file (in circular mode) may look as follows:
perfview -AcceptEULA -ThreadTime -CircularMB:500 -Circular:1 -LogFile:perf.output -Merge:TRUE -Zip:TRUE -noView collect
A new console window will open with the following text:
Pre V4.0 .NET Rundown enabled, Type 'D' to disable and speed up .NET Rundown.
Do NOT close this console window.   It will leave collection on!
Type S to stop collection, 'A' will abort.  (Also consider /MaxCollectSec:N)

Type 'S' when you are done with tracing and wait (DO NOT CLOSE THE WINDOW) till you see `Press enter to close window`. Then copy the files: PerfViewData.etl.zip and perf.output to the machine when you will perform analysis.
If you are also interested in the network traces append the -NetMonCapture option. This will generate an additional PerfViewData_netmon.cab file.
If we use the EventSource provider and want to collect the call stacks along with the events, we need to append @StacksEnabled=true to the provider name, for example: *EFTrace:@StacksEnabled=true.
Tips on analyzing events
Select a time range and press Alt+R to set it for the grid. We may also copy a range, paste it in the Start box and then press Enter to apply it (PerfView should fill the End box).
The table below contains grouping patterns I use for various analysis targets
| Name | Pattern |
|---|---|
| Just my code with folded threads | [My app + folded threads] \Temporary ASP.NET Files\->;!dynamicClass.S->;!=>OTHER;Thread->AllThreads |
| Just my code with folded threads (ASP.NET view) | [My app + folded threads and ASP.NET requests] Thread -> AllThreads;Request ID * URL: {*}-> URL $1;\Temporary ASP.NET Files\->;!dynamicClass.S->;!=>OTHER |
| Just my code with folded threads (Server requests view) | [My app + folded threads and requests] Thread -> AllThreads;ASP.NET Request: * URL: {*}-> URL $1;\Temporary ASP.NET Files\->;!dynamicClass.S->;!=>OTHER |
| Group requests | ^Request ID->ALL Requests |
| Group requests by URL | Request ID * URL:{*}->$1 |
| Group async calls (by Christophe Nasarre) | {%}!{%}+<>c__DisplayClass*+<<{%}>b__*>d.MoveNext()->($1) $2 async $3 |
When exporting to Excel, the data coming from PerfView often does not have valid formatting and contains some strange characters at the beginning or at the end, for example:
0000 A0 A0 32 32 34 224
We may clean up those values by using the SUBSTITUTE function, for example:
=SUBSTITUTE(A1,LEFT(A1,1),"")
=SUBSTITUTE(A1,RIGHT(A1,1),"")
And later do the usual Copy, Paste as Values operation. Alternatively, we may copy the values column by column. In that case, PerfView won’t insert those special characters.
If we want to open a trace created by PerfView in WPA, we need to first convert it, for example:
perfview /wpr unzip test.etl.zip
# The above command should create two files (.etl and .etl.ngenpdb)
# and we can open wpa
wpa test.etl
Live view of events
The Listen user command enables a live view dump of events in the PerfView log:
PerfView.exe UserCommand Listen Microsoft-JScript:0x7:Verbose

# inspired by Konrad Kokosa's tweet
PerfView.exe UserCommand Listen Microsoft-Windows-DotNETRuntime:0x1:Verbose:@EventIDsToEnable="1 2"
Issues
Error 0x800700B7 (ERROR_ALREADY_EXISTS)
[Kernel Log: C:\tools\PerfViewData.kernel.etl]
    Kernel keywords enabled: Default
    Aborting tracing for sessions 'NT Kernel Logger' and 'PerfViewSession'.
    Insuring .NET Allocation profiler not installed.
    Completed: Collecting data C:\tools\PerfViewData.etl   (Elapsed Time: 0,858 sec)
    Exception Occured: System.Runtime.InteropServices.COMException (0x800700B7): Cannot create a file when that file already exists. (Exception from HRESULT: 0x800700B7)
       at System.Runtime.InteropServices.Marshal.ThrowExceptionForHRInternal(Int32 errorCode, IntPtr errorInfo)
       at Microsoft.Diagnostics.Tracing.Session.TraceEventSession.EnableKernelProvider(Keywords flags, Keywords stackCapture)
       at PerfView.CommandProcessor.Start(CommandLineArgs parsedArgs)
       at PerfView.CommandProcessor.Collect(CommandLineArgs parsedArgs)
       at PerfView.MainWindow.c__DisplayClass9.b__7()
       at PerfView.StatusBar.c__DisplayClass8.b__6(Object param0)
    An exceptional condition occurred, see log for details.
If you receive such error, make sure that no kernel log is running with perfview listsessions and eventually kill it with perfview abort.
logman
Nowadays, logman will not be our first choice tool to collect ETW trace, but the best thing about it is that it is a built-in tool and has been available in Windows for many years already, so might be the only option if you need to work on a legacy Windows system.
Querying providers installed in the system
Logman is great for querying ETW providers installed in the system or activated in a given process:
# list all providers in the system
logman query providers

# show details about the ".NET Common Language Runtime" provider
logman query providers ".NET Common Language Runtime"

# list providers active in a process with ID 808
logman query providers -pid 808
Starting and stopping the trace
The following commands start and stop a tracing session that is using one provider:
logman start mysession -p {9744AD71-6D44-4462-8694-46BD49FC7C0C} -o "c:\temp\test.etl" -ets & timeout -1 & logman stop mysession -ets
For the provider options you may additionally specify the keywords (flags) and levels that will be logged: -p provider [flags [level]]
You may also use a file with a list of providers:
logman start mysession -pf providers.guids -o c:\temp\test.etl -ets & timeout -1 & logman stop mysession -ets
And the providers.guids file content is built of lines following the format: {guid} [flags] [level] [provider name] (flags, level, and provider name are optional), for example:
{AFF081FE-0247-4275-9C4E-021F3DC1DA35} 0xf    5  ASP.NET Events
{3A2A4E84-4C21-4981-AE10-3FDA0D9B0F83} 0x1ffe 5  IIS: WWW Server
If you want to record events from the kernel provider you need to name the session: NT Kernel Logger, for example:
logman start "NT Kernel Logger" -p "Windows Kernel Trace" "(process,thread,file,fileio,net)" -o c:\kernel.etl -ets & timeout -1 & logman stop "NT Kernel Logger" -ets
To see the available kernel provider keywords, run:
logman query providers "Windows Kernel Trace"

# Provider                                 GUID
# -------------------------------------------------------------------------------
# Windows Kernel Trace                     {9E814AAD-3204-11D2-9A82-006008A86939}
#
# Value               Keyword              Description
# -------------------------------------------------------------------------------
# 0x0000000000000001  process              Process creations/deletions
# 0x0000000000000002  thread               Thread creations/deletions
# ...
Additionally, we may change the way how events are saved to the file using the -mode parameter. For example, to use a circular file with maximum size of 200MB, we can run the following command:
logman start "NT Kernel Logger" -p "Windows Kernel Trace" "(process,thread,img)" -o C:\ntlm-kernel.etl -mode circular -max 200 -ets
wevtutil
Wevtutil is a built-in tool that allows us to manage manifest-based providers (publishers) installed in our system. Example usages:
# list all installed publishers
wevtutil ep
# find MSMQ publishers
wevtutil ep | findstr /i msmq

# extract details about a Microsoft-Windows-MSMQ publisher
wevtutil gp Microsoft-Windows-MSMQ /ge /gm /f:xml
tracerpt
Tracerpt is another built-in tool. It may collect ETW traces, but I usually use it only to convert etl files from binary to text format. Example commands:
# convert etl file to evtx
tracerpt -of EVTX test.etl -o test.evtx -summary test-summary.xml

# dump events to an XML file
tracerpt test.etl -o test.xml -summary test-summary.xml

# dump events to a HTML file
tracerpt.exe '.\NT Kernel Logger.etl' -o -report -f html
xperf
For a long time xperf was the best tool to collect ETW traces, providing ways to configure many aspects of the tracing sessions. It is now considered legacy (with wpr being its replacement), but many people still find its command line syntax eaier to use than WPR profiles. Here are some usage examples:
# list available Kernel Flags
xperf -providers KF
#       PROC_THREAD         : Process and Thread create/delete
#       LOADER              : Kernel and user mode Image Load/Unload events
#       PROFILE             : CPU Sample profile
#       CSWITCH             : Context Switch
#       ...

# list available Kernel Groups
xperf -providers KG
#       Base           : PROC_THREAD+LOADER+DISK_IO+HARD_FAULTS+PROFILE+MEMINFO+MEMINFO_WS
#       Diag           : PROC_THREAD+LOADER+DISK_IO+HARD_FAULTS+DPC+INTERRUPT+CSWITCH+PERF_COUNTER+COMPACT_CSWITCH
#       DiagEasy       : PROC_THREAD+LOADER+DISK_IO+HARD_FAULTS+DPC+INTERRUPT+CSWITCH+PERF_COUNTER
#       ...

# list installed providers
xperf -providers I
#       0063715b-eeda-4007-9429-ad526f62696e                              : Microsoft-Windows-Services
#       0075e1ab-e1d1-5d1f-35f5-da36fb4f41b1                              : Microsoft-Windows-Network-ExecutionContext
#       00b7e1df-b469-4c69-9c41-53a6576e3dad                              : Microsoft-Windows-Security-IdentityStore
#       01090065-b467-4503-9b28-533766761087                              : Microsoft-Windows-ParentalControls
#       ...

# start the kernel trace, enabling flags defined in the DiagEasy group
xperf -on DiagEasy
# stop the kernel trace
xperf -stop -d "c:\temp\DiagEasy.etl"

# start the kernel with some additional settings and wait for the user to stop it
xperf -on Latency -stackwalk Profile -buffersize 2048 -MaxFile 1024 -FileMode Circular && timeout -1 && xperf stop -d "C:\highCPUUsage.etl"

# in user-mode tracing you may still use kernel flags and groups but for each user-trace provider
# you need to add some additional parameters: -on (GUID|KnownProviderName)[:Flags[:Level[:0xnnnnnnnn|'stack|[,]sid|[,]tsid']]]
xperf -start ClrRundownSession -on ClrAll:0x118:5+a669021c-c450-4609-a035-5af59af4df18:0x118:5 -f clr_DCend.etl -buffersize 128 -minbuffers 256 -maxbuffers 512
timeout /t 15
xperf -stop ClrSession ClrRundownSession -stop -d cpu_clr.etl

# dump collected events to a text file
xperf -i test.etl -o test.csv
Chad Schultz published many xperf scripts in the WindowsPerformance repository, so check them out if you are interested in using xperf.
TSS (TroubleShootingScript toolset)
TSS contains tons of various scripts and ETW is only a part of it. TSS official documentation is here and we can download the package from https://aka.ms/getTSS.
Here is an example PowerShell script to install and run the main script:
powershell.exe -NoProfile -ExecutionPolicy RemoteSigned -Command "Invoke-WebRequest -Uri https://aka.ms/getTSS -OutFile $env:TEMP\TSS.zip; Unblock-File $env:TEMP\TSS.zip; Expand-Archive -Force -LiteralPath $env:TEMP\TSS.zip -DestinationPath C:\TSS; Remove-Item $env:TEMP\TSS.zip; C:\TSS\TSS.ps1 -ListSupportedTrace"
TSS defined many troubleshooting scenarios with precompiled parameters:
C:\tSS\TSS.ps1 -ListSupportedScenarioTrace
# ...
# NET_General        - collects CommonTask NET, NetshScenario InternetClient_dbg, Procmon, PSR, Video, SDP NET, xray, CollectComponentLog
# ...
where:
CommonTaskare commands run before and after the scenario (onlyNETin this case)NetshScenariois the selected netsh scenario (InternetClient_dbg)Procmonwill start procmonPSRwill run step recorderVideowill record a video of what the user is doingSDP(Support Diagnostic Package) andNETenableGeneral,SMB, andNETcountersxrayruns xray scripts to discover existing problemsCollectComponentLogcollects logs of commands run in a given scenario
To start a scenario, we run:
C:\TSS\TSS.ps1 -Scenario NET_General
We may also manually “compose” the TSS command. A nice GUI tool for this purpose is .\TSSGUI.ps1 (start it from the TSS folder). We may also list available TSS features:
C:\TSS\TSS.ps1 -ListSupportedCommands
C:\TSS\TSS.ps1 -ListSupportedControls
C:\TSS\TSS.ps1 -ListSupportedDiag
C:\TSS\TSS.ps1 -ListSupportedLog
C:\TSS\TSS.ps1 -ListSupportedNetshScenario
C:\TSS\TSS.ps1 -ListSupportedNoOptions
C:\TSS\TSS.ps1 -ListSupportedPerfCounters
C:\TSS\TSS.ps1 -ListSupportedScenarioTrace
C:\TSS\TSS.ps1 -ListSupportedSDP
C:\TSS\TSS.ps1 -ListSupportedSetOptions
C:\TSS\TSS.ps1 -ListSupportedTrace
C:\TSS\TSS.ps1 -ListSupportedWPRScenario
C:\TSS\TSS.ps1 -ListSupportedXperfProfile
Example commands to check which ETW providers the NET_COM component is using:
.\TSS.ps1 -ListSupportedTrace | select-string "_COM"
# [Component]  -NET_COM                  COM/DCOM/WinRT/PRC component tracing. -EnableCOMDebug will enable further debug logging
# [Component]  -UEX_COM                  COM/DCOM/WinRT/PRC component ETW tracing. -EnableCOMDebug will enable further debug logging
# Usage:
#   .\TSS.ps1 -<ComponentName> -<ComponentName>
#   Example: .\TSS.ps1 -UEX_FSLogix -UEX_Logon

.\TSS -ListETWProviders NeT_COM

# List of 20 Provider GUIDs (Flags/Level) for ComponentName: NET_COM
# ==========================================================
# {9474a749-a98d-4f52-9f45-5b20247e4f01}
# {bda92ae8-9f11-4d49-ba1d-a4c2abca692e}
# ...
The TSS commands create raports in the C:\MS_DATA folder.
To collect the trace in the background we may use the -StartNoWait option and -Stop to stop the trace.
If we add the -StartAutoLogger option, our trace will start when the system boots. We stop by calling TSS.ps1 -Stop, as usual.
Example commands:
# starting WPR using TSS
C:\TSS\TSS.ps1 -WPR CPU -WPROptions "-start Dotnet -start DesktopComposition"

# Starting time travel debugging session using TSS
# 1234 is the process PID (we may use process name as well, for example winver.exe)
C:\TSS\TSS.ps1 -AcceptEula -TTD 1234
MSO scripts (PowerShell)
MSO-Scripts repository hosts many interesting PowerShell scripts for working with ETW traces.
Event types
Autologger events
Autologger ETW session collects events appearing after the system start. It can be enabled with wpr:
wpr.exe -boottrace -addboot FileIO
Additional information:
System boot events
To collect general profile traces use:
wpr.exe -start generalprofile -onoffscenario boot -numiterations 1
File events
Described in a post on my blog.
Registry events
Described in a post on my blog.
WPP events
WPP events are legacy events, for which we need TMF files to decode their payload. TMF may be available as standalone files or they might be embedded into PDB files. For the latter case, we may extract them using tracepdb.exe, for example:
tracepdb.exe -f .\combase.pdb -p .\tmfs
TMF data is stored as a binary block in the PDB file:
0D9:46A0  BA 00 19 10 20 52 0A 00 01 00 06 00 54 4D 46 3A  º... R......TMF:
0D9:46B0  00 64 61 66 38 39 65 63 31 2D 64 66 66 32 2D 33  .daf89ec1-dff2-3
0D9:46C0  30 35 35 2D 36 30 61 62 2D 36 33 64 34 63 31 31  055-60ab-63d4c11
0D9:46D0  62 33 64 39 63 20 4F 4C 45 43 4F 4D 20 2F 2F 20  b3d9c OLECOM //
0D9:46E0  53 52 43 3D 63 6F 6D 74 72 61 63 65 77 6F 72 6B  SRC=comtracework
0D9:46F0  65 72 2E 63 78 78 20 4D 4A 3D 20 4D 4E 3D 00 23  er.cxx MJ= MN=.#
0D9:4700  74 79 70 65 76 20 63 6F 6D 74 72 61 63 65 77 6F  typev comtracewo
0D9:4710  72 6B 65 72 5F 63 78 78 31 38 36 20 31 31 20 22  rker_cxx186 11 "
0D9:4720  25 30 25 31 30 21 73 21 22 20 2F 2F 20 20 20 4C  %0%10!s!" //   L
0D9:4730  45 56 45 4C 3D 57 41 52 4E 49 4E 47 00 7B 00 6D  EVEL=WARNING.{.m
0D9:4740  65 73 73 61 67 65 2C 20 49 74 65 6D 57 53 74 72  essage, ItemWStr
0D9:4750  69 6E 67 20 2D 2D 20 31 30 00 7D 00 BA 00 19 10  ing -- 10.}.º...
The GUID at the beginning of the block defines the provider ID and may appear multiple times in the PDB file. Tracepdb uses this ID as the name of the generated TMF file. When decoding WPP events, if we do not configure the TDH_CONTEXT_WPP_TMFSEARCHPATH, Tdh functions will look for TMF files in the path specified in the TRACE_FORMAT_SEARCH_PATH environment variable. WPA has a special view for WPP events and can load the TMF manifests from symbol files, so remember to first load the symbols.
Libraries
This section lists some of the ETW libraries I used with my notes about them. It is not meant to be a comprehensive documentation of those libraries, but rather a list of tips and tricks.
ETW tools and libs (including EtwEnumerator)
This C++ library contains code to parse ETW events. The sample EtwEnumerator CLI tool formats events from a binary etl file to their text representation.
To build the library run:
cd EtwEnumerator
cmake -B bin .
cmake --build bin
The EtwEnumerator instance stores information about the currently analyzed event in an efficient way, caching metadata for future processing of similar events. Please check the README. Below is an example C# code that formats event to a JSON string in the ETW callback function:
EtwStringViewZ etwString;
fixed (char* formatPtr = "[%9]%8.%3::%4 [%1]")
{
   if (!ee->FormatCurrentEvent((ushort*)formatPtr, EtwJsonSuffixFlags.EtwJsonSuffixFlags_Default, &etwString))
   {
       Trace.WriteLine("ERROR");
       return;
   }
}

var s = new string((char*)etwString.Data, 0, (int)etwString.DataLength);
writer.TryWrite(new MessageEvent(s));
TraceProcessing
| Documentation | Code samples |
TraceProcessing library categorized the events and splits them between Trace Processor. Before processing the trace, we mark Trace Processors that we want to active, and we may query the events they processed after the analysis finishes, for example:
using var trace = TraceProcessor.Create(traceFilePath);

var pendingProcesses = trace.UseProcesses();
var pendingFileIO = trace.UseFileIOData();

trace.Process();

var filecopyProcess = pendingProcesses.Result.Processes.Where(p => p.ImageName == "filecopy.exe").First();

var fev = pendingFileIO.Result.CreateFileObjectActivity.First(f => f.IssuingProcess.Id == filecopyProcess.Id
                && f.FileName == "sampling-2-1.etl");

Console.WriteLine($"Create file event: {fev.Path} ({fev.FileObject})");
The above code uses the buffered mode of opening a trace file, in which all processed events land in memory (we may notice that the application memory consumption will be really high for bigger traces). Therefore, for bigger traces we may also use the streaming mode, but not all event types support it. An example session using streaming mode might be coded as follows:
using var trace = TraceProcessor.Create(traceFilePath);
var pendingProcesses = trace.UseProcesses();
int filecopyProcessId = 0;

long eventCount = 0;
long filecopyEventCount = 0;

// ConsumerSchedule defines when our parser will be called, for example, we may choose
// SecondPass when buffered processors will be available
trace.UseStreaming().UseUnparsedEvents(ConsumerSchedule.Default, context =>
{
    eventCount++;
});

trace.UseStreaming().UseUnparsedEvents(ConsumerSchedule.SecondPass, context =>
{
    if (filecopyProcessId == 0)
    {
        filecopyProcessId = pendingProcesses.Result.Processes.Where(p => p.ImageName == "filecopy.exe").First().Id;
    }
    if (context.Event.ProcessId == filecopyProcessId)
    {
        filecopyEventCount++;
    }
});

trace.Process();

return (filecopyEventCount, eventCount);
In my tests, I discovered that GenericEvents processor is not very reliable as I could not find some of the events (for example, FileIo), visible in other tools, but maybe I was doing something wrong :)
WPRContol
WPRControl is the COM object used by, for example, wpr.exe. Its API is well-documented, with KernelTraceControl.h and WindowsPerformanceRecordedControl.h headers and IDLs available for our usage.
TraceEvent
| Source code | Documentation |
TraceEvent is a huge library which is the tracing engine that PerfView uses for collecting and processing events.
When iterating through collected events, remember to clone the events you need for future processing as the current TraceEvent instance is in-memory replaced by the next analyzed event. For example the requestStartEvent and requestStopEvent in the code below will contain invalid data at the end of the loop (we should be calling ev.Clone() to save the event):
TraceEvent? requestStartEvent = null, requestStopEvent = null;
foreach (var ev in traceLog.Events.Where(ev => ev.ProviderGuid == aspNetProviderId))
{
    if (ev.ActivityID == activityIdGuid)
    {
        if (ev.ID == (TraceEventID)2) // Request/Start
        {
            requestStartEvent = ev;
        }
        if (ev.ID == (TraceEventID)3) // Request/Stop
        {
            requestStopEvent = ev;
        }
    }
}

// requestStartEvent i requestStopEvent zawierają błędne dane, ponieważ obiekt, którego wewnętrznie używają ma nadpisane dane przez późniejsze eventy
If you are interested how TraceEvent library processes the ETW events, the good place to start is the ETWTraceEventSource.RawDispatchClassic event callback function. It uses TraceEvent.Lookup to create the final instance of the TraceEvent class.
KrabsETW
KrabsETW is used by the Office 365 Security team. An example code to start a live session looks as follows:
using Microsoft.O365.Security.ETW;
using Microsoft.O365.Security.ETW.Kernel;

using var trace = new KernelTrace("krabsetw-lab");

var processProvider = new ProcessProvider();

processProvider.OnEvent += (record) =>
{
    if (record.Opcode == 0x01)
    {
        var image = record.GetAnsiString("ImageFileName", "Unknown");
        var pid = record.GetUInt32("ProcessId", 0);
        Console.WriteLine($"{image} started with PID {pid}");
    }
};

trace.Enable(processProvider);

Console.CancelKeyPress += (sender, ev) =>
{
    ev.Cancel = true;
    trace.Stop();
};

trace.Start();
The KrabsETW is implemented in C++ CLI which complicates the deployment. Firstly, I needed to add <RuntimeIdentifier>win-x64</RuntimeIdentifier> to my csproj file to fix a problem with missing Ijwhost.dll library. However, it still produced errors when trimming and the application was failing:
dotnet publish -c release -r win-x64 -p:PublishSingleFile=true -p:PublishTrimmed=true --self-contained -p:IncludeNativeLibrariesForSelfExtract=true
# MSBuild version 17.6.8+c70978d4d for .NET
#   Determining projects to restore...
#   All projects are up-to-date for restore.
#   krabsetw-lab -> C:\code\krabsetw-lab\bin\release\net7.0-windows\win-x64\krabsetw-lab.dl
#   l
#   Optimizing assemblies for size. This process might take a while.
# C:\Users\me\.nuget\packages\microsoft.o365.security.native.etw\4.3.1\lib\net6.0\Microsoft.O365.Security.Native.ETW.dll
# : warning IL2104: Assembly 'Microsoft.O365.Security.Native.ETW' produced trim warnings. For more information see https:
# //aka.ms/dotnet-illink/libraries [C:\code\krabsetw-lab\krabsetw-lab.csproj]
#   krabsetw-lab -> C:\code\krabsetw-lab\bin\release\net7.0-windows\win-x64\publish\
krabsetw-lab.exe
# Unhandled exception. System.BadImageFormatException:
# File name: 'C:\code\krabsetw-lab\bin\release\net7.0-windows\win-x64\publish\Microsoft.O365.Security.Native.ETW.dll'
#    at Program.<Main>$(String[] args)
When processing events, KrabsETW uses schema_locator to cache and decode payload of a given event:
struct schema_key
{
    guid      provider;
    uint16_t  id;
    uint8_t   opcode;
    uint8_t   version;
    uint8_t   level;

    // ...
}


inline const PTRACE_EVENT_INFO schema_locator::get_event_schema(const EVENT_RECORD &record) const
{
    // check the cache
    auto key = schema_key(record);
    auto& buffer = cache_[key];

    if (!buffer) {
        auto temp = get_event_schema_from_tdh(record);
        buffer.swap(temp);
    }

    return (PTRACE_EVENT_INFO)(buffer.get());
}
Performance Logs and Alerts (PLA)
PLA is a COM library used by logman to provide trace collection options. The library registration can be located in the registry:
Computer\HKEY_CLASSES_ROOT\CLSID\{03837513-098B-11D8-9414-505054503030}
The main DLLs are pla.dll and plasrv.exe.
For example, the ITraceDataProviderCollection::GetTraceDataProvidersByProcess method, responsible for querying providers in a process, calls TraceSession::LoadGuidArray, which then uses EnumerateTraceGuidsEx.
System API
Low-level API to collect and analyze traces - all above libraries use these functions.