Diagnosing .NET applications
![]() I also authored the .NET Diagnostics Expert course, available at Dotnetos
I also authored the .NET Diagnostics Expert course, available at Dotnetos ![]() Academy. Apart from the theory, it contains lots of demos and troubleshooting guidelines. Check it out if you’re interested in learning .NET troubleshooting.
Academy. Apart from the theory, it contains lots of demos and troubleshooting guidelines. Check it out if you’re interested in learning .NET troubleshooting. ![]()
Table of contents:
- General .NET debugging tips
- Diagnosing exceptions or erroneous behavior
- Diagnosing hangs
- Diagnosing waits or high CPU usage
- Diagnosing managed memory leaks
- Diagnosing issues with assembly loading
- Diagnosing network connectivity issues
- ASP.NET Core
- ASP.NET (.NET Framework)
- Interesting OSS tools and libraries
General .NET debugging tips
Loading the SOS extension into WinDbg
When debugging a .NET Framework application, WinDbgX should automatically find a correct version of the SOS.dll. If it fails to do so and your .NET Framework version matches the one of the target app, use the following command:
.loadby sos mscorwks (.NET 2.0/3.5)
.loadby sos clr      (.NET 4.0+)
For .NET Core, you need to download and install the dotnet-sos tool. The install command informs how to load SOS into WinDbg, for example:
> dotnet tool install -g dotnet-sos
...
> dotnet sos install
...
Execute '.load C:\Users\me\.dotnet\sos\sos.dll' to load SOS in your Windows debugger.
Cleaning up...
SOS install succeeded
SOS commands sometimes get overriden by other extensions help files. In such case, use !sos.help [cmd] command, for example, !sos.help !savemodule.
Manually loading symbol files for .NET Core
I noticed that sometimes Microsoft public symbol servers do not have .NET Core dlls symbols. That does not allow WinDbg to decode native .NET stacks. Fortunately, we may solve this problem by precaching symbol files using the dotnet-symbol tool. Assuming we set our _NT_SYMBOL_PATH to SRV*C:\symbols\dbg*https://msdl.microsoft.com/download/symbols, we need to run dotnet-symbol with the –cache-directory parameter pointing to our symbol cache folder (for example, C:\symbols\dbg):
dotnet-symbol --recurse-subdirectories --cache-directory c:\symbols\dbg -o C:\temp\toremove "C:\Program Files\dotnet\shared\Microsoft.NETCore.App\3.0.0\*"
We may later remove the C:\temp\toremove folder as all PDB files are indexed in the cache directory. The output folder contains both DLL and PDB files, takes lots of space, and is often not required.
Disabling JIT optimization
For .NET Core, set the COMPlus_JITMinOptsx environment variable:
export COMPlus_JITMinOpts=1
For .NET Framework, you need to create an ini file. The ini file must have the same name as the executable with only extension changed to ini, eg. my.ini file will work with my.exe application.
[.NET Framework Debugging Control]
GenerateTrackingInfo=1
AllowOptimize=0
Decoding managed stacks in Sysinternals
As of version 16.22 version, Process Explorer understands managed stacks and should display them correctly when you double click on a thread in a process.
Process Monitor, unfortunately, lacks this feature. Pure managed modules will appear as <unknown> in the call stack view. However, we may fix the problem for the ngened assemblies. First, you need to generate a .pdb file for the ngened assembly, for example, ngen createPDB c:\Windows\assembly\NativeImages_v4.0.30319_64\mscorlib\e2c5db271896923f5450a77229fb2077\mscorlib.ni.dll c:\symbols\private. Then make sure you have this path in your _NT_SYMBOL_PATH variable, for example, C:\symbols\private;SRV*C:\symbols\dbg*http://msdl.microsoft.com/download/symbols. If procmon still does not resolve the symbols, go to Options - Configure Symbols and reload the dbghelp.dll. I observe this issue in version 3.50.
Check runtime version
For .NET Framework 2.0, you could check the version of mscorwks in the file properties or, if in debugger, using lmmv. For .NET Framework 4.x, you need to check clr.dll (or the Release value under the HKEY_LOCAL_MACHINE\SOFTWARE\Microsoft\NET Framework Setup\NDP\v4\Full key) and find it in the Microsoft Docs.
In .NET Core, we could run dotnet –list-runtimes command to list the available runtimes.
Debugging/tracing a containerized .NET application (Docker)
With the introduction of EventPipes in .NET Core 2.1, the easiest approach is to create a shared /tmp volume and use a sidecar diagnostics container. A sample Dockerfile.netdiag may look as follows:
FROM mcr.microsoft.com/dotnet/sdk:5.0 AS base

RUN apt-get update && apt-get install -y lldb; \
    dotnet tool install -g dotnet-symbol; \
    dotnet tool install -g dotnet-sos; \
    /root/.dotnet/tools/dotnet-sos install

RUN dotnet tool install -g dotnet-counters; \
  dotnet tool install -g dotnet-trace; \
  dotnet tool install -g dotnet-dump; \
  dotnet tool install -g dotnet-gcdump; \
  echo 'export PATH="$PATH:/root/.dotnet/tools"' >> /root/.bashrc

ENTRYPOINT ["/bin/bash"]
You may use it to create a .NET diagnostics Docker image, for example:
$ docker build -t netdiag -f .\Dockerfile.netdiag .
Then, create a /tmp volume and mount it into your .NET application container, for example:
$ docker volume create dotnet-tmp

$ docker run --rm --name helloserver --mount "source=dotnet-tmp,target=/tmp" -p 13000:13000 helloserver 13000
And you are ready to run the diagnostics container and diagnose the remote application:
$ docker run --rm -it --mount "source=dotnet-tmp,target=/tmp" --pid=container:helloserver netdiag

root@d4bfaa3a9322:/# dotnet-trace ps
         1 dotnet     /usr/share/dotnet/dotnet
If you only want to trace the application with dotnet-trace, consider using a shorter Dockerfile.nettrace file:
FROM mcr.microsoft.com/dotnet/sdk:5.0 AS base

RUN dotnet tool install -g dotnet-trace

ENTRYPOINT ["/root/.dotnet/tools/dotnet-trace", "collect", "-n", "dotnet", "-o", "/work/trace.nettrace", "@/work/input.rsp"]
where input.rsp:
--providers Microsoft-Windows-DotNETRuntime:0x14C14FCCBD:4,Microsoft-DotNETCore-SampleProfiler:0xF00000000000:4
The nettrace container will automatically start the tracing session enabling the providers from the input.rsp file. It also assumes the destination process name is dotnet:
$ docker build -t nettrace -f .\Dockerfile.nettrace .

$ docker run --rm --pid=container:helloserver --mount "source=dotnet-tmp,target=/tmp" -v "$pwd/:/work" -it nettrace

Provider Name                           Keywords            Level               Enabled By
Microsoft-Windows-DotNETRuntime         0x00000014C14FCCBD  Informational(4)    --providers
Microsoft-DotNETCore-SampleProfiler     0x0000F00000000000  Informational(4)    --providers

Process        : /usr/share/dotnet/dotnet
Output File    : /work/trace.nettrace
[00:00:00:02]   Recording trace 261.502  (KB)
Press <Enter> or <Ctrl+C> to exit...11   (KB)
Stopping the trace. This may take up to minutes depending on the application being traced.
Diagnosing exceptions or erroneous behavior
Using Time Travel Debugging (TTD)
Time Travel Debugging is an excellent way of troubleshooting errors and exceptions. We can step through the code causing the problems at our own pace. I describe TTD in a WinDbg guide. It is my preferred way of debugging issues in applications and I highly recommend giving it a try.
Collecting a memory dump
dotnet-dump is one of the .NET diagnostics CLI tools. You may download it using curl or wget, for example: curl -JLO https://aka.ms/dotnet-dump/win-x64.
To create a full memory dump, run one of the commands:
dotnet-dump collect -p <process-id>
dotnet-dump collect -n <process-name>
You may create a heap-only memory dump by adding the –type=Heap option.
Createdump shares the location with the coreclr library, for example, for .NET 5: /usr/share/dotnet/shared/Microsoft.NETCore.App/5.0.3/createdump or c:\Program Files\dotnet\shared\Microsoft.NETCore.App\5.0.3\createdump.exe.
To create a full memory dump, run createdump –full {process-id}. With no options provided, it creates a memory dump with heap memory, which equals to createdump –withheap {pid}.
The .NET application may run createdump automatically on crash. We configure this feature through environment variables, for example:
# enable a memory dump creation on crash
set DOTNET_DbgEnableMiniDump=1
# when crashing, create a heap (2) memory dump, (4) for full memory dump
set DOTNET_DbgMiniDumpType=2
Apart from the .NET tools described above, you may create memory dumps with tools described in the guide dedicated to diagnosing native Windows applications. As those tools usually do not understand .NET memory layout, I recommend creating full memory dumps to have all the necessary metadata for later analysis.
Analysing exception information
First make sure with the !Threads command (SOS) that your current thread is the one with the exception context:
0:000> !Threads
ThreadCount:      2
UnstartedThread:  0
BackgroundThread: 1
PendingThread:    0
DeadThread:       0
Hosted Runtime:   no

ID OSID ThreadOBJ           State GC Mode     GC Alloc Context                  Domain           Count Apt Exception
0    1 1ec8 000000000055adf0    2a020 Preemptive  0000000002253560:0000000002253FD0 00000000004fb970 0     Ukn System.ArgumentException 0000000002253438
5    2 1c74 00000000005851a0    2b220 Preemptive  0000000000000000:0000000000000000 00000000004fb970 0     Ukn (Finalizer)
In the snippet above we can see that the exception was thrown on the thread no. 0 and this is our currently selected thread (in case it’s not, we would use ~0s command) so we may use the !PrintException command from SOS (alias !pe), for example:
0:000> !pe
Exception object: 0000000002253438
Exception type:   System.ArgumentException
Message:          v should not be null
InnerException:   <none>
StackTrace (generated):
<none>
StackTraceString: <none>
HResult: 80070057
To see the full managed call stack, use the !CLRStack command. By default, the debugger will stop on an unhandled exception. If you want to stop at the moment when an exception is thrown (first-chance exception), run the sxe clr command at the beginning of the debugging session.
Diagnosing hangs
We usually start the analysis by looking at the threads running in a process. The call stacks help us identify blocked threads. We can use TTD, thread-time trace, or memory dumps to learn about what threads are doing. In the follow-up sections, I will describe how to find lock objects and relations between threads in memory dumps.
Listing threads call stacks
To list native stacks for all the threads in WinDbg, run: ~*k or ~*e!dumpstack. If you are interested only in managed stacks, you may use the ~*e!clrstack SOS command. The dotnet-dump’s analyze command provides a super useful parallel stacks command:
> dotnet dump analyze test.dmp
> pstacks
________________________________________________
    ~~~~ 5cd8
       1 System.Threading.Monitor.Enter(Object, Boolean ByRef)
       1 deadlock.Program.Lock2()
    ~~~~ 3e58
       1 System.Threading.Monitor.Enter(Object, Boolean ByRef)
       1 deadlock.Program.Lock1()
  2 System.Threading.Tasks.Task.InnerInvoke()
  ...
  2 System.Threading.ThreadPoolWorkQueue.Dispatch()
  2 System.Threading._ThreadPoolWaitCallback.PerformWaitCallback()
In LLDB, we may show native call stacks for all the threads with the bt all command. Unfortunately, if we want to use !dumpstack or !clrstack commands, we need to manually switch between threads with the thread select command.
Finding locks in managed code
You may examine thin locks using !DumpHeap -thinlocks. To find all sync blocks, use the !SyncBlk -all command.
On .NET Framework, you may also use the !dlk command from the SOSEX extension. It is pretty good in detecting deadlocks, for example:
0:007> .load sosex
0:007> !dlk
Examining SyncBlocks...
Scanning for ReaderWriterLock(Slim) instances...
Scanning for holders of ReaderWriterLock locks...
Scanning for holders of ReaderWriterLockSlim locks...
Examining CriticalSections...
Scanning for threads waiting on SyncBlocks...
Scanning for threads waiting on ReaderWriterLock locks...
Scanning for threads waiting on ReaderWriterLocksSlim locks...
*** WARNING: Unable to verify checksum for C:\WINDOWS\assembly\NativeImages_v4.0.30319_32\System\3a4f0a84904c4b568b6621b30306261c\System.ni.dll
*** WARNING: Unable to verify checksum for C:\WINDOWS\assembly\NativeImages_v4.0.30319_32\System.Transactions\ebef418f08844f99287024d1790a62a4\System.Transactions.ni.dll
Scanning for threads waiting on CriticalSections...
*DEADLOCK DETECTED*
CLR thread 0x1 holds the lock on SyncBlock 011e59b0 OBJ:02e93410[System.Object]
...and is waiting on CriticalSection 01216a58
CLR thread 0x3 holds CriticalSection 01216a58
...and is waiting for the lock on SyncBlock 011e59b0 OBJ:02e93410[System.Object]
CLR Thread 0x1 is waiting at clr!CrstBase::SpinEnter+0x92
CLR Thread 0x3 is waiting at System.Threading.Monitor.Enter(System.Object, Boolean ByRef)(+0x17 Native)
When debugging locks in code that is using tasks it is often necessary to examine execution contexts assigned to the running threads. I prepared a simple script which lists threads with their execution contexts. You only need (as in previous script) to find the MT of the Thread class in your appdomain, e.g.
0:036> !Name2EE mscorlib.dll System.Threading.Thread
Module:      72551000
Assembly:    mscorlib.dll
Token:       020001d1
MethodTable: 72954960
EEClass:     725bc0c4
Name:        System.Threading.Thread
And then paste it in the scripts below:
x86 version:
.foreach ($addr {!DumpHeap -short -mt <METHODTABLE> }) { .printf /D "Thread: %i; Execution context: <link cmd=\"!do %p\">%p</link>\n", poi(${$addr}+28), poi(${$addr}+8), poi(${$addr}+8) }
x64 version:
.foreach ($addr {!DumpHeap -short -mt <METHODTABLE> }) { .printf /D "Thread: %i; Execution context: <link cmd=\"!do %p\">%p</link>\n", poi(${$addr}+4c), poi(${$addr}+10), poi(${$addr}+10) }
Notice that the thread number from the output is a managed thread id and to map it to the windbg thread number you need to use the !Threads command.
Diagnosing waits or high CPU usage
Dotnet-trace allows us to enable the runtime CPU sampling provider (Microsoft-DotNETCore-SampleProfiler). However, using it might impact application performance as it internally calls ThreadSuspend::SuspendEE to suspend managed code execution while collecting the samples. Although it is a sampling profiler, it is a bit special. It runs on a separate thread and collects stacks of all the managed threads, even the waiting ones. This behavior resembles the thread time profiler. Probably that’s the reason why PerfView shows us the Thread Time view when opening the .nettrace file.
Sample collect examples:
dotnet-trace collect --profile cpu-sampling -p 12345
dotnet-trace collect --profile cpu-sampling -- myapp.exe
Dotnet-trace does not automatically enable DiagnosticSource or TPL providers. Therefore, if we want to see activities in PerfView, we need to turn them on manually, for example:
dotnet-trace collect --profile cpu-sampling --providers "Microsoft-Diagnostics-DiagnosticSource:0xFFFFFFFFFFFFF7FF:4:FilterAndPayloadSpecs=HttpHandlerDiagnosticListener/System.Net.Http.Request@Activity2Start:Request.RequestUri\nHttpHandlerDiagnosticListener/System.Net.Http.Response@Activity2Stop:Response.StatusCode,System.Threading.Tasks.TplEventSource:1FF:5" -n testapp
For diagnosing CPU problems in .NET applications running on Windows, we may also rely on ETW (Event Tracing for Windows). In a guide dedicated to diagnosing native applications, I describe how to collect and analyze ETW traces.
On Linux, we additionally have the perfcollect script. It is the easiest way to use Linux Kernel perf_events for diagnosing .NET apps. In my tests, however, I found that quite often, it did not correctly resolve .NET stacks.
To collect CPU samples with perfcollect, use the perfcollect collect command. To also enable the Thread Time events, add the -threadtime option. If only possible, I would recommend opening the traces (even the ones from Linux) in PerfView. But if it’s impossible, try the view command of the perfcollect script, for example:
perfcollect view sqrt.trace.zip -graphtype caller
Using the -graphtype option, we may switch from the top-down view (caller) to the bottom-up view (callee).
Diagnosing managed memory leaks
Collecting memory snapshots
If we are interested only in GC Heaps, we may create the GC Heap snapshot using PerfView:
perfview heapsnapshot <pid|name>
In GUI, we may use the menu option: Memory -> Take Heap Snapshot.
For .NET Core applications, we have a CLI tool: dotnet-gcdump, which you may get from the https://aka.ms/dotnet-gcdump/runtime-id URL, for example, https://aka.ms/dotnet-gcdump/linux-x64. And to collect the GC dump we need to run one of the commands:
dotnet-gcdump -p <process-id>
dotnet-gcdump -n <process-name>
Sometimes managed heap is not enough to diagnose the memory leak. In such situations, we need to create a memory dump, as described in a guide dedicated to diagnosing native applications.
Analyzing collected snapshots
PerfView can open GC Heap snapshots and dumps. If you only have a memory dump, you may convert a memory dump file to a PerfView snapshot using PerfView HeapSnapshotFromProcessDump ProcessDumpFile {DataFile} or using the GUI options Memory -> Take Heap Snapshot from Dump.
I would like to bring your attention to an excellent diffing option available for heap snapshots. Imagine you made two heap snapshots of the leaking process:
- first named LeakingProcess.gcdump
- second (taken a minute later) named LeakingProcess.1.gcdump
You may now run PerfView, open two collected snapshots, switch to the LeakingProcess.1.gcdump and under the Diff menu you should see an option to diff this snapshot with the baseline:
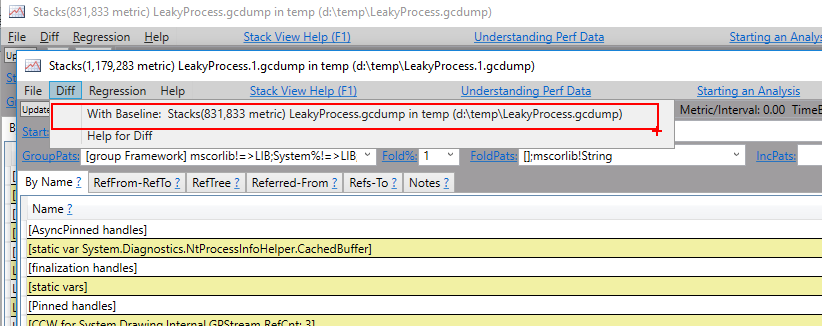
After you choose it, a new window will pop up with a tree of objects which have changed between the snapshots. Of course, if you have more snapshots you can generate diffs between them all. A really powerful feature!
WinDbg allows you to analyze the full memory dumps. Make sure that bitness of the dump matches bitness of the debugger. Then load the SOS extension and identify objects which use most of the memory using !DumpHeap -stat. Later, analyze the references using the !GCRoot command.
Other SOS commands for analyzing the managed heap include:
!EEHeap [-gc] [-loader]
!HeapStat [-inclUnrooted | -iu]

!DumpHeap [-stat]
          [-strings]
          [-short]
          [-min <size>]
          [-max <size>]
          [-live]
          [-dead]
          [-thinlock]
          [-startAtLowerBound]
          [-mt <MethodTable address>]
          [-type <partial type name>]
          [start [end]]

!ObjSize [<Object address>]
!GCRoot [-nostacks] <Object address>
!DumpObject <address> | !DumpArray <address> | !DumpVC <mt> <address>
dotnet-gcdump has a report command that lists the objects recorded in the GC heaps. The output resembles output from the SOS !dumpheap command.
Diagnosing issues with assembly loading
Troubleshooting loading with EventPipes/ETW (.NET)
The Loader keyword (0x8) in the Microsoft-Windows-DotNETRuntime provider enables events relating to loading and unloading of appdomains, assemblies and modules.
Starting with .NET 5, the new AssemblyLoader keyword (0x4) gives us a detailed view of the assembly resolution process. Additionally, we can group the activity events per assembly using the ActivityID.
dotnet-trace collect --providers Microsoft-Windows-DotNETRuntime:C -- testapp.exe
Troubleshooting loading using ETW (.NET Framework)
There is a number of ETW events defined under the Microsoft-Windows-DotNETRuntimePrivate/Binding/ category. We may use, for example, PerfView to collect them. Just make sure that you have the .NET check box selected in the collection dialog. Start collection and stop it after the loading exception occurs. Then open the .etl file, go to the Events screen and filter them by binding. Select all of the events and press ENTER. PerfView will immediately print the instances of the selected events in the grid on the right. You may later search or filter the grid with the help of the search boxes above it.
Troubleshooting loading using Fusion log (.NET Framework)
Fusion log is available in all versions of the .NET Framework. There is a tool named fuslogvw in .NET SDK, which you may use to set the Fusion log configuration. Andreas Wäscher implemented an easier-to-use version of this tool, with a modern UI, named Fusion++. You may download the precompiled version from the release page.
If using neither of the above tools is possible (for example, you are in a restricted environment), you may configure the Fusion log through registry settings. The root of all the Fusion log settings is HKEY_LOCAL_MACHINE\SOFTWARE\Microsoft\Fusion.
When writing to a folder on a hard drive fusion logs are split among categories and processes, e.g.:
C:\TEMP\FUSLOGVW
├───Default
│   └───powershell.exe
└───NativeImage
    └───powershell.exe
Log to exception text:
HKEY_LOCAL_MACHINE\software\microsoft\fusion
    EnableLog    REG_DWORD    0x1
or
reg delete HKLM\Software\Microsoft\Fusion /va
reg add HKLM\Software\Microsoft\Fusion /v EnableLog /t REG_DWORD /d 0x1
Log failures to disk:
HKEY_LOCAL_MACHINE\software\microsoft\fusion
    LogFailures    REG_DWORD    0x1
    LogPath    REG_SZ    c:\logs\fuslogvw
or
reg delete HKLM\Software\Microsoft\Fusion /va
reg add HKLM\Software\Microsoft\Fusion /v LogFailures /t REG_DWORD /d 0x1
reg add HKLM\Software\Microsoft\Fusion /v LogPath /t REG_SZ /d "C:\logs\fuslogvw"
Log all binds to disk
HKEY_LOCAL_MACHINE\software\microsoft\fusion
    LogPath    REG_SZ    c:\logs\fuslogvw
    ForceLog    REG_DWORD    0x1
or
reg delete HKLM\Software\Microsoft\Fusion /va
reg add HKLM\Software\Microsoft\Fusion /v ForceLog /t REG_DWORD /d 0x1
reg add HKLM\Software\Microsoft\Fusion /v LogPath /t REG_SZ /d "C:\logs\fuslogvw"
Log disabled
HKEY_LOCAL_MACHINE\software\microsoft\fusion
    LogPath    REG_SZ    c:\logs\fuslogvw
or
reg delete HKLM\Software\Microsoft\Fusion /va
GAC (.NET Framework)
For .NET2.0/3.5 Global Assembly Cache was located in c:\Windows\assembly folder with a drag/drop option for installing/uninstalling assemblies. Citing a stackoverflow answer:
This functionality is provided by a custom shell extension, shfusion.dll. It flattens the GAC and makes it look like a single folder. And takes care of automatically un/registering the assemblies for you when you manipulate the explorer window. So you’re fine doing this.
To disable GAC viewer in Windows Explorer, add a DWORD value DisableCacheViewer set to 1 under the HKLM\Software\Microsoft\Fusion key.
Note that this will no longer work for .NET 4, it uses in a different folder to store GAC files (c:\windows\microsoft.net\assembly) and that folder does not have the same kind of shell extension. Thus, you can see the raw content of it. However, you should not directly use it.
It is best to use gacutil to manipulate GAC content. Though it’s possible to install assembly in both GAC folders as stated here, but I would not consider it a good practice as framework tools can’t deal with it. .NET GAC settings are stored under the registry key: HKLM\Software\Microsoft\Fusion.
Find assembly in cache
We can use the gacutil /l to find an assembly in GAC. If no name is provided, the command lists all the assemblies in cache.
gacutil /l System.Core

The Global Assembly Cache contains the following assemblies:
  System.Core, Version=3.5.0.0, Culture=neutral, PublicKeyToken=b77a5c561934e089, processorArchitecture=MSIL
  System.Core, Version=4.0.0.0, Culture=neutral, PublicKeyToken=b77a5c561934e089, processorArchitecture=MSIL

Number of items = 2
Uninstall assembly from cache
gacutil /u MyTest.exe
Diagnosing network connectivity issues
.NET Core
.NET Core provides a number of ETW and EventPipes providers to collect the network tracing events. Enabling the providers could be done in dotnet-trace, PerfView, or dotnet-wtrace. Network ETW providers use only two keywords (Default = 0x1 and Debug = 0x2) and, as usual, we may filter the events by the log level (from 1 (critical) to 5 (verbose)).
In .NET 5, the providers were renamed and currently we can use the following names:
-
Private.InternalDiagnostics.System.Net.Primitives- cookie container, cache credentials logs -
Private.InternalDiagnostics.System.Net.Sockets- logs describing operations on sockets, connection status events, Private.InternalDiagnostics.System.Net.NameResolutionPrivate.InternalDiagnostics.System.Net.Mail-
Private.InternalDiagnostics.System.Net.Requests- logs from System.Net.Requests classes Private.InternalDiagnostics.System.Net.HttpListenerPrivate.InternalDiagnostics.System.Net.WinHttpHandler-
Private.InternalDiagnostics.System.Net.Http- HttpClient and HTTP handler logs, authentication events -
Private.InternalDiagnostics.System.Net.Security- SecureChannel (TLS) events, Windows SSPI logs
For previous .NET Core versions, the names were as follows:
Microsoft-System-Net-PrimitivesMicrosoft-System-Net-SocketsMicrosoft-System-Net-NameResolutionMicrosoft-System-Net-MailMicrosoft-System-Net-RequestsMicrosoft-System-Net-HttpListenerMicrosoft-System-Net-WinHttpHandlerMicrosoft-System-Net-HttpMicrosoft-System-Net-Security
We may create a network.rsp file that enables all these event sources and the Kestrel one. You may use it with dotnet-trace, for example:
$ dotnet-trace collect -n dotnet @network.rsp
The network.rsp file for older .NET Core (before .NET 5) might look as follows:
--providers Microsoft-System-Net-Primitives,Microsoft-System-Net-Sockets,Microsoft-System-Net-NameResolution,Microsoft-System-Net-Mail,Microsoft-System-Net-Requests,Microsoft-System-Net-HttpListener,Microsoft-System-Net-WinHttpHandler,Microsoft-System-Net-Http,Microsoft-System-Net-Security,Microsoft-AspNetCore-Server-Kestrel
For .NET 5 and newer:
--providers
Private.InternalDiagnostics.System.Net.Primitives,Private.InternalDiagnostics.System.Net.Sockets,Private.InternalDiagnostics.System.Net.NameResolution,Private.InternalDiagnostics.System.Net.Mail,Private.InternalDiagnostics.System.Net.Requests,Private.InternalDiagnostics.System.Net.HttpListener,Private.InternalDiagnostics.System.Net.WinHttpHandler,Private.InternalDiagnostics.System.Net.Http,Private.InternalDiagnostics.System.Net.Security,Microsoft-AspNetCore-Server-Kestrel
I also developed dotnet-wtrace, a lightweight traces that makes it straightfoward to live collect .NET events, including network traces.
.NET Framework
All classes from System.Net, if configured properly, may provide a lot of interesting logs through the default System.Diagnostics mechanisms. The list of the available trace sources is available in Microsoft docs.
This is a configuration sample which writes network traces to a file:
<system.diagnostics>
    <trace autoflush="true" />
    <sharedListeners>
      <add name="file" initializeData="C:\logs\network.log" type="System.Diagnostics.TextWriterTraceListener" />
    </sharedListeners>
    <sources>
      <source name="System.Net" switchValue="Verbose" tracemode="includehex" maxdatasize="512">
        <listeners>
          <add name="file" />
        </listeners>
      </source>
      <source name="System.Net.Http" switchValue="Verbose">
        <listeners>
          <add name="file" />
        </listeners>
      </source>
      <source name="System.Net.HttpListener" switchValue="Verbose">
        <listeners>
          <add name="file" />
        </listeners>
      </source>
      <source name="System.Net.Sockets" switchValue="Verbose">
        <listeners>
          <add name="file" />
        </listeners>
      </source>
    </sources>
</system.diagnostics>
These logs may be verbose and numerous, therefore, I suggest starting with Information level and smaller number of sources. You may also consider using EventProviderTraceListener to make the trace writes faster and less impactful. An example configuration file with those changes:
<system.diagnostics>
    <trace autoflush="true" />
    <sharedListeners>
      <add name="etw" initializeData="{0f09a664-1713-4665-91e8-8d6b8baee030}" type="System.Diagnostics.Eventing.EventProviderTraceListener, System.Core, Version=4.0.0.0, Culture=neutral, PublicKeyToken=b77a5c561934e089" />
    </sharedListeners>
    <sources>
      <source name="System.Net" switchValue="Information">
        <listeners>
          <add name="etw" />
        </listeners>
      </source>
      <source name="System.Net.Http" switchValue="Information">
        <listeners>
          <add name="etw"/>
        </listeners>
      </source>
      <source name="System.Net.HttpListener" switchValue="Information">
        <listeners>
          <add name="etw"/>
        </listeners>
      </source>
    </sources>
</system.diagnostics>
And to collect such a trace:
logman start "net-trace-session" -p "{0f09a664-1713-4665-91e8-8d6b8baee030}" -bs 512 -nb 8 64 -o "c:\temp\net-trace.etl" -ets & pause & logman stop net-trace-session -ets
ASP.NET Core
Collecting ASP.NET Core logs
For low-level network traces, you may enable .NET network providers, as described in the previous section. ASP.NET Core framework logs events either through DiagnosticSource using Microsoft.AspNetCore as the source name or through the ILogger interface.
ILogger logs
The CreateDefaultBuilder method adds LoggingEventSource (named Microsoft-Extensions-Logging) as one of the log outputs. The FilterSpecs argument makes it possible to filter the events by logger name and level, for example:
Microsoft-Extensions-Logging:5:5:FilterSpecs=webapp.Pages.IndexModel:0
We may define the log message format with keywords (pick one):
- 0x1 - enable meta events
- 0x2 - enable events with raw arguments
- 0x4 - enable events with formatted message (the most readable)
- 0x8 - enable events with data seriazlied to JSON
For example, to collect ILogger info messages: dotnet-trace collect -p PID --providers "Microsoft-Extensions-Logging:0x4:0x4"
DiagnosticSource logs
To listen to DiagnosticSource events, we should enable the Microsoft-Diagnostics-DiagnosticSource event source. DiagnosticSource events often contain complex types and we need to use parser specifications to extract the interesting properties.
The Microsoft-Diagnostics-DiagnosticSourcex event source some special keywords:
- 0x1 - enable diagnostic messages
- 0x2 - enable regular events
- 0x0800 - disable the shortcuts keywords, listed below
- 0x1000 - enable activity tracking and basic hosting events (ASP.NET Core)
- 0x2000 - enable activity tracking and basic command events (EF Core)
Also, we should enable the minimal logging from the System.Threading.Tasks.TplEventSource provider to profit from the activity tracking.
When our application is hosted on the Kestrel server, we may enable the Microsoft-AspNetCore-Server-Kestrel provider to get Kestrel events.
An example command that enables all ASP.NET Core event traces and some other useful network event providers. It also adds activity tracking for HttpClient requests:
> dotnet-trace collect --providers "Private.InternalDiagnostics.System.Net.Security,Private.InternalDiagnostics.System.Net.Sockets,Microsoft-AspNetCore-Server-Kestrel,Microsoft-Diagnostics-DiagnosticSource:0x1003:5:FilterAndPayloadSpecs=\"Microsoft.AspNetCore\nHttpHandlerDiagnosticListener\nHttpHandlerDiagnosticListener/System.Net.Http.Request@Activity2Start:Request.RequestUri\nHttpHandlerDiagnosticListener/System.Net.Http.Response@Activity2Stop:Response.StatusCode\",System.Threading.Tasks.TplEventSource:0x80:4,Microsoft-Extensions-Logging:4:5" -n webapp
Collecting ASP.NET Core performance counters
ASP.NET Core provides some basic performance counters through the Microsoft.AspNetCore.Hosting event source. If we are also using Kestrel, we may add some interesting counters by enabling Microsoft-AspNetCore-Server-Kestrel:
> dotnet-counters monitor "Microsoft.AspNetCore.Hosting" "Microsoft-AspNetCore-Server-Kestrel" -n testapp

Press p to pause, r to resume, q to quit.
    Status: Running

[Microsoft.AspNetCore.Hosting]
    Current Requests                                                0
    Failed Requests                                                 0
    Request Rate (Count / 1 sec)                                    0
    Total Requests                                                  0
[Microsoft-AspNetCore-Server-Kestrel]
    Connection Queue Length                                        0
    Connection Rate (Count / 1 sec)                                0
    Current Connections                                            1
    Current TLS Handshakes                                         0
    Current Upgraded Requests (WebSockets)                         0
    Failed TLS Handshakes                                          2
    Request Queue Length                                           0
    TLS Handshake Rate (Count / 1 sec)                             0
    Total Connections                                              7
    Total TLS Handshakes                                           7
ASP.NET (.NET Framework)
Examining ASP.NET process memory (and dumps)
Some useful PSSCOR4 commands for ASP.NET:
!ProcInfo [-env] [-time] [-mem]

FindDebugTrue

!FindDebugModules [-full]

!DumpHttpContext dumps the HttpContexts in the heap.  It shows the status of the request and the return code, etc.  It also prints out the start time

!ASPXPages just calls !DumpHttpContext to print out information on the ASPX pages  running on threads.

!DumpASPNETCache [-short] [-stat] [-s]

!DumpRequestTable [-a] [-p] [-i] [-c] [-m] [-q] [-n] [-e] [-w] [-h]                   [-r] [-t] [-x] [-dw] [-dh] [-de] [-dx]

!DumpHistoryTable [-a]
!DumpHistoryTable dumps the aspnet_wp history table.

!DumpBuckets dumps entire request table buckets.

!GetWorkItems given a CLinkListNode, print out request & work items.
Netext commands for ASP.NET:
!whttp [/order] [/running] [/withthread] [/status <decimal>] [/notstatus <decimal>] [/verb <string>] [<expr>] - dump HttpContext objects

!wconfig - dump configuration sections loaded into memory

!wruntime - dump all active Http Runtime information
Profiling ASP.NET
Application instrumentation
Interesting tools and libraries:
We may also use the ASP.NET trace listener to print diagnostic message to the page trace. In the configuration file below, we configure the Performance TraceSource to pass events to the ASP.NET trace listener.
<?xml version="1.0"?>
<configuration>
  <system.diagnostics>
    <trace autoflush="true" />
    <sharedListeners>
      <add name="WebPageTraceListener" type="System.Web.WebPageTraceListener, System.Web, Version=4.0.0.0, Culture=neutral, PublicKeyToken=b03f5f7f11d50a3a" />
    </sharedListeners>
    <sources>
      <source name="Performance" switchValue="Verbose">
        <listeners>
          <add name="WebPageTraceListener" />
        </listeners>
      </source>
    </sources>
  </system.diagnostics>

  <system.web>
    <trace enabled="true" localOnly="true" pageOutput="false" />

    <customErrors mode="Off">
    </customErrors>

    <compilation debug="true" targetFramework="4.0">
    </compilation>
  </system.web>
</configuration>
ASP.NET ETW providers
ASP.NET ETW providers are defined in the aspnet.mof file in the main .NET Framework folder. They should be installed with the framework:
> logman query /providers "ASP.NET Events"

Provider                                 GUID
-------------------------------------------------------------------------------
ASP.NET Events                           {AFF081FE-0247-4275-9C4E-021F3DC1DA35}

Value               Keyword              Description
-------------------------------------------------------------------------------
0x0000000000000001  Infrastructure       Infrastructure Events
0x0000000000000002  Module               Pipeline Module Events
0x0000000000000004  Page                 Page Events
0x0000000000000008  AppServices          Application Services Events

Value               Level                Description
-------------------------------------------------------------------------------
0x01                Fatal                Abnormal exit or termination
0x02                Error                Severe errors
0x03                Warning              Warnings
0x04                Information          Information
0x05                Verbose              Detailed information
If they are not, use mofcomp.exe to install them.
To start collecting trace events from the ASP.NET and IIS providers run the following command:
logman start aspnettrace -pf ctrl-iis-aspnet.guids -ct perf -o aspnet.etl -ets
where the ctrl-iis-aspnet.guids looks as follows:
{AFF081FE-0247-4275-9C4E-021F3DC1DA35} 0xf    5  ASP.NET Events
{3A2A4E84-4C21-4981-AE10-3FDA0D9B0F83} 0x1ffe 5  IIS: WWW Server
And stop it with the command:
logman stop aspnettrace -ets
Collect events using the Perfecto tool
Perfecto is a tool that creates an ASP.NET data collector in the system and allows you to generate nice reports of requests made to your ASP.NET application. After installing you can either use the perfmon to start the report generation:
- On perfmon, navigate to the “Performance\Data Collector Sets\User Defined\ASPNET Perfecto” node.
- Click the “Start the Data Collector Set” button on the tool bar.
- Wait for/or make requests to the server (more than 10 seconds).
- Click the “Stop the Data Collector Set” button on the tool bar.
- Click the “View latest report” button on the tool bar or navigate to the last report at “Performance\Reports\User Defined\ASPNET Perfecto”
or logman:
logman.exe start -n "Service\ASPNET Perfecto"

logman.exe stop -n "Service\ASPNET Perfecto"
Note: The View commands are also available as toolbar buttons. Sometimes you can see an error like below:
Error Code: 0xc0000bf8
Error Message: At least one of the input binary log files contain fewer than two data samples.
This usually happens when you collected data too fast. The performance counters are set by default to collect every 10 seconds. So a fast start/stop sequence may end without enough counter data being collected. Always allow more than 10 seconds between a start and stop commands. Or otherwise delete the performance counters collector or change the sample interval.
Requirements:
- Windows >= Vista
- Installed IIS tracing (
dism /online /enable-feature /featurename:IIS-HttpTracing)
Collect events using FREB
New IIS servers (7.0 up) contain a nice diagnostics functionality called Failed Request Tracing (or FREB). You may find a lot of information how to enable it on the IIS official site and in my iis debugging recipe.
Interesting OSS tools and libraries
Some interesting libraries to use when implementing your own troubleshooting tools:
- dotnet-diagnostics
- clrmd - a library to analyze live .NET processes and memory dumps
- sharpdbg - a managed code debugger implemented in C#
- ClrDebug - managed wrappers for .NET unmamanged APIs (debugging, profiling)