COM troubleshooting
Table of contents:
- Quick introduction to COM
- Troubleshooting COM in WinDbg
- Observing COM interactions outside WinDbg
- Troubleshooting .NET COM interop
- Links
Quick introduction to COM
In COM, everything is about interfaces. In old times, when various compiler vendors were fighting over whose “standard” was better, the only reliable way to call C++ class methods contained in third-party libraries was to use virtual tables. As its name suggests virtual table is a table, to be precise, a table of addresses (pointers). The “virtual” adjective relates to the fact that our table’s addresses point to virtual methods. If you’re familiar with object programming (you plan to debug COM, so you should!), you probably thought of inheritance and abstract classes. And that’s correct! The abstract class is how we implement interfaces in C++ (to be more precise an abstract class with pure virtual methods). Now, COM is all about passing pointers to those various virtual tables which happen to have GUID identifiers. The most important interface (parent of all interfaces) is IUnknown. Every COM interface must inherit from this interface. Why? For two reasons: to manage the object lifetime and to access all the other interfaces that our object may implement (or, in other words, to find all virtual tables our object is aware of). As this interface is so important, let’s have a quick look at its definition:
struct __declspec(uuid("00000000-0000-0000-C000-000000000046"))) IUnknown
{
public:
    virtual HRESULT STDMETHODCALLTYPE QueryInterface(REFIID riid, void **ppvObject) = 0;
    virtual ULONG STDMETHODCALLTYPE AddRef( void) = 0;
    virtual ULONG STDMETHODCALLTYPE Release( void) = 0;
};
Guess which methods are responsible for lifetime management and which are for interface querying. OK, so we know the declaration, but to debug COM, we need to understand how COM objects are laid out in the memory. Let’s have a look at a sample Probe class (the snippet comes from my Protoss COM example repository):
struct __declspec(uuid("59644217-3e52-4202-ba49-f473590cc61a")) IGameObject : public IUnknown
{
public:
    virtual HRESULT STDMETHODCALLTYPE get_Name(BSTR* name) = 0;
    virtual HRESULT STDMETHODCALLTYPE get_Minerals(LONG* minerals) = 0;
    virtual HRESULT STDMETHODCALLTYPE get_BuildTime(LONG* buildtime) = 0;
};

struct __declspec(uuid("246A22D5-CF02-44B2-BF09-AAB95A34E0CF")) IProbe : public IUnknown
{
public:
    virtual HRESULT STDMETHODCALLTYPE ConstructBuilding(BSTR building_name, IUnknown * *ppUnk) = 0;
};

class __declspec(uuid("EFF8970E-C50F-45E0-9284-291CE5A6F771")) Probe final : public IProbe, public IGameObject
{
    ULONG ref_count;
    /* ... implementation ....  */
}
If we instantiate (more on that later) the Probe class, its layout in the memory will look as follows:
0:000> dps 0xfb2f58 L4
00fb2f58  72367744 protoss!Probe::`vftable'
00fb2f5c  7236775c protoss!Probe::`vftable'
00fb2f60  00000001
00fb2f64  fdfdfdfd

0:000> dps 72367744 L4 * IProbe interface
72367744  72341bb3 protoss!ILT+2990(?QueryInterfaceProbeUAGJABU_GUIDPAPAXZ)
72367748  72341ba9 protoss!ILT+2980(?AddRefProbeUAGKXZ)
7236774c  723411ae protoss!ILT+425(?ReleaseProbeUAGKXZ)
72367750  723414d3 protoss!ILT+1230(?ConstructBuildingProbeUAGJPA_WPAPAUIUnknownZ)

0:000> dps 7236775c L6 * IGameUnit interface
7236775c  72341e3d protoss!ILT+3640(?QueryInterfaceProbeW3AGJABU_GUIDPAPAXZ)
72367760  723416fe protoss!ILT+1785(?AddRefProbeW3AGKXZ)
72367764  72341096 protoss!ILT+145(?ReleaseProbeW3AGKXZ)
72367768  723415f0 protoss!ILT+1515(?get_NameProbeUAGJPAPA_WZ)
7236776c  723419d8 protoss!ILT+2515(?get_MineralsProbeUAGJPAJZ)
72367770  72341e1a protoss!ILT+3605(?get_BuildTimeProbeUAGJPAJZ)
Notice the pointers at the beginning of the object memory. As you can see in the snippet, those pointers reference arrays of function pointers or, as you remember, virtual tables. Each virtual table represents a COM interface, like IProbe or IGameObject in our case.
Let’s now briefly discuss the creation of COM objects. We usually start by calling one of the well-known Co-functions to create a COM object. Often, it’s either CoCreateInstance or CoGetClassObject. Those functions perform actions defined in the COM registration (either in a manifest file or in the registry). In the most common (and most straightforward scenario), they load a dll and run the exported DllGetClassObject function:
HRESULT DllGetClassObject([in] REFCLSID rclsid, [in] REFIID riid, [out] LPVOID *ppv);
On a successful return, the *ppv value should point to an address of the virtual table representing a COM interface with the IID equal to riid. And this address will be a part of memory belonging to a COM object of the type identified by the rclsid.
People often say that COM is complicated. As you just saw, COM fundamentals are clear and straightforward. However, its various implementations might cause a headache. For example, there are myriads of methods in OLE and ActiveX interfaces created to make it possible to drag/drop things between windows, use the clipboard, or embed one control in another. Remember, though, that all those crazy interfaces still need to implement IUnknown. And that’s the advantage we can take as troubleshooters. It’s easy to track new instance creations, interface queries, and interface method calls (often even with their names). That may give us enough insights to debug a problem successfully.
COM metadata
COM metadata, saved in type libraries, provides definitions of COM classes and COM interfaces. Thanks to it, we can decode method names and their argument values without debugging symbols. The tool we usually use to view the type libraries installed in the system is OleView, part of the Windows SDK. OleView has some open-source alternatives, such as .NET OLE/COM viewer or OleWoo. Comon also provides the !cometa command, which allows you to use COM metadata without leaving WinDbg. Before the debugging session, it is worth taking a moment to build the cometa database with the !cometa index command. The database resides in a temporary folder. It’s an SQLite database, so you may copy it between machines. Other comon commands will use the cometa database to resolve class and interface IDs to meaningful names.
You may also do some basic queries against the database with the !cometa showc and !cometa showi commands, for example:
0:000> !cometa showi {59644217-3E52-4202-BA49-F473590CC61A}
Found: {59644217-3E52-4202-BA49-F473590CC61A} (IGameObject)

Methods:
- [0] HRESULT QueryInterface(void* this, GUID* riid, void** ppvObject)
- [1] ULONG AddRef(void* this)
- [2] ULONG Release(void* this)
- [3] HRESULT get_Name(void* this, BSTR* Name)
- [4] HRESULT get_Minerals(void* this, long* Minerals)
- [5] HRESULT get_BuildTime(void* this, long* BuildTime)

Registered VTables for IID:
- Module: protoss, CLSID: {EFF8970E-C50F-45E0-9284-291CE5A6F771} (Probe), VTable offset: 0x3775c
- Module: protoss, CLSID: {F5353C58-CFD9-4204-8D92-D274C7578B53} (Nexus), VTable offset: 0x37710
Troubleshooting COM in WinDbg
Monitoring COM objects in a process
There are various ways in which COM objects can be created. When a given function creates a COM object, you will see a void ** as one of its arguments. After a successful call, this pointer will point to a new COM object. Let’s check how we can trace such a creation. We will use breakpoints to monitor calls to the CoCreateInstance(REFCLSID rclsid, LPUNKNOWN pUnkOuter, DWORD dwClsContext, REFIID riid, LPVOID *ppv) function. We are interested in the class (rclsid) and interface (riid) values, and the address of the created COM object (*ppv). When debugging a 64-bit process, our breakpoint command might look as follows:
bp combase!CoCreateInstance ".echo ==== combase!CoCreateInstance ====; dps @rsp L8; dx *(combase!GUID*)@rcx; dx *(combase!GUID*)@r9; .printf /D \"==> obj addr: %p\", poi(@rsp+28);.echo; bp /1 @$ra; g"
The bp /1 @$ra part creates a one-time breakpoint at a function return address. This second breakpoint will stop the process execution and allow us to examine the results of the function call. At this time, the rax register will show the return code (should be 0 for a successful call), and the created COM object (and also the interface virtual) will be at the previously printed object address. For the sake of completeness, let me show you the 32-bit version of this breakpoint:
bp combase!CoCreateInstance ".echo ==== combase!CoCreateInstance ====; dps @esp L8; dx **(combase!GUID **)(@esp + 4); dx **(combase!GUID **)(@esp + 0x10); .printf /D \"==> obj addr: %p\", poi(@esp+14);.echo; bp /1 @$ra; g"
Creating such breakpoints for various COM functions might be a mundane task, especially when we consider that our only point in doing so is to save the addresses of the virtual tables. Fortunately, comon might be of help here. In-process COM creation usually ends in a call to the DllGetClassObject function exported by the DLL implementing a given COM object. After attaching to a process (!comon attach), comon creates breakpoints on all such functions and checks the results of their executions. It also breaks when a process calls CoRegisterClassObject, a function called by out-of-process COM servers to register the COM objects they host.
After you attach comon to a debugged process, you should see various log messages showing COM object creations, for example:
0:000> !comon attach
COM monitor enabled for the current process.
0:000> g
...
[comon] 0:000 [protoss!DllGetClassObject] CLSID: {EFF8970E-C50F-45E0-9284-291CE5A6F771} (Protoss Probe), IID: {00000001-0000-0000-C000-000000000046} (IClassFactory) -> SUCCESS (0x0)
[comon] 0:000 [IClassFactory::CreateInstance] CLSID: {EFF8970E-C50F-45E0-9284-291CE5A6F771} (Protoss Probe), IID: {246A22D5-CF02-44B2-BF09-AAB95A34E0CF} (IProbe) -> SUCCESS (0x0)
[comon] 0:000 [IUnknown::QueryInterface] CLSID: {EFF8970E-C50F-45E0-9284-291CE5A6F771} (Protoss Probe), IID: {59644217-3E52-4202-BA49-F473590CC61A} (IGameObject) -> SUCCESS (0x0)
[comon] 0:000 [protoss!DllGetClassObject] CLSID: {F5353C58-CFD9-4204-8D92-D274C7578B53} (Protoss Nexus), IID: {00000001-0000-0000-C000-000000000046} (IClassFactory) -> SUCCESS (0x0)
[comon] 0:000 [IClassFactory::CreateInstance] CLSID: {F5353C58-CFD9-4204-8D92-D274C7578B53} (Protoss Nexus), IID: {C5F45CBC-4439-418C-A9F9-05AC67525E43} (INexus) -> SUCCESS (0x0)
[comon] 0:000 [IUnknown::QueryInterface] CLSID: {F5353C58-CFD9-4204-8D92-D274C7578B53} (Protoss Nexus), IID: {59644217-3E52-4202-BA49-F473590CC61A} (IGameObject) -> SUCCESS (0x0)
...
The QueryInterface calls will show up only for the first time; it won’t be reported if we have the virtual table for a given interface already registered in the cometa database. To check the COM objects registered in a given session, run the !comon status command, for example:
0:000> !comon status
COM monitor is RUNNING

COM types recorded for the current process:

CLSID: {F5353C58-CFD9-4204-8D92-D274C7578B53} (Nexus)
  IID: {C5F45CBC-4439-418C-A9F9-05AC67525E43} (INexus), address: 0x723676f8
  IID: {00000001-0000-0000-C000-000000000046} (N/A), address: 0x7236694c
  IID: {59644217-3E52-4202-BA49-F473590CC61A} (IGameObject), address: 0x72367710

CLSID: {EFF8970E-C50F-45E0-9284-291CE5A6F771} (Probe)
  IID: {00000001-0000-0000-C000-000000000046} (N/A), address: 0x72366968
  IID: {59644217-3E52-4202-BA49-F473590CC61A} (IGameObject), address: 0x7236775c
  IID: {246A22D5-CF02-44B2-BF09-AAB95A34E0CF} (IProbe), address: 0x72367744
The cometa queries show now also return information about the registered virtual tables:
0:000> !cometa showc {F5353C58-CFD9-4204-8D92-D274C7578B53}
Found: {F5353C58-CFD9-4204-8D92-D274C7578B53} (Nexus)

Registered VTables for CLSID:
- module: protoss, IID: {00000001-0000-0000-C000-000000000046} (N/A), VTable offset: 0x3694c
- module: protoss, IID: {59644217-3E52-4202-BA49-F473590CC61A} (IGameObject), VTable offset: 0x37710
- module: protoss, IID: {C5F45CBC-4439-418C-A9F9-05AC67525E43} (INexus), VTable offset: 0x376f8
Tracing COM methods
When we know the interface virtual table address, nothing can stop us from creating breakpoints on interface methods :) I will first show you how to do that manually and later present how comon may help.
The first step is to find the offset of our method in the interface definition. Let’s stick to the Protoss COM example and let’s create a breakpoint on the get_Minerals method/property from the IGameObject interface:
0:000> !cometa showi {59644217-3E52-4202-BA49-F473590CC61A}
Found: {59644217-3E52-4202-BA49-F473590CC61A} (IGameObject)

Methods:
- [0] HRESULT QueryInterface(void* this, GUID* riid, void** ppvObject)
- [1] ULONG AddRef(void* this)
- [2] ULONG Release(void* this)
- [3] HRESULT get_Name(void* this, BSTR* Name)
- [4] HRESULT get_Minerals(void* this, long* Minerals)
- [5] HRESULT get_BuildTime(void* this, long* BuildTime)

Registered VTables for IID:
- Module: protoss, CLSID: {EFF8970E-C50F-45E0-9284-291CE5A6F771} (Probe), VTable offset: 0x3775c
- Module: protoss, CLSID: {F5353C58-CFD9-4204-8D92-D274C7578B53} (Nexus), VTable offset: 0x37710
We can see that its ordinal number is four, and two virtual tables are registered for our interface (two classes implementing it). Let’s focus on the Probe class. To set a breakpoint method, we can use the bp command:
bp poi(protoss + 0x3775c + 4 * $ptrsize)
Similarly, if we would like to set breakpoints on all the IGameObject methods, we might use a loop:
.for (r $t0 = 0; @$t0 < 6; r $t0 = @$t0 + 1) { bp poi(protoss + 0x3775c + @$t0 * @$ptrsize) }
Instead of setting breakpoints manually, you may use the !cobp command from the comon extension. It also creates a breakpoint (you will see it if you run the bl command), but on hit, comon will decode the method parameters (for the supported types). It will also automatically create a one-time breakpoint on the method return address, displaying the return code and method out parameter values. The optional parameter lets you decide if you’d like to stop when cobreakpoint is hit. An example output might look as follows:
0:000> !cobp --always {EFF8970E-C50F-45E0-9284-291CE5A6F771} {59644217-3E52-4202-BA49-F473590CC61A} get_Name
[comon] Breakpoint 18 (address 0x723415f0) created / updated
0:000> g
[comon breakpoint] IGameObject::get_Name (iid: {59644217-3E52-4202-BA49-F473590CC61A}, clsid: {EFF8970E-C50F-45E0-9284-291CE5A6F771})

Parameters:
- this: 0xfb2f5c (void*)
- Name: 0x81fc1c (BSTR*) [out]

0:000> dps 0081fc1c L1
0081fc1c  00000000
0:000> g
[comon breakpoint] IGameObject::get_Name (iid: {59644217-3E52-4202-BA49-F473590CC61A}, clsid: {EFF8970E-C50F-45E0-9284-291CE5A6F771}) return
Result: 0x0 (HRESULT)

Out parameters:
- Name: 0x81fc1c (BSTR*)

0:000> du 00f9c6ac
00f9c6ac  "Probe"
If comon can’t decode a given parameter, you may use the dx command with combase.dll symbols (one of the rare Microsoft DLLs that comes with private symbols), for example: dx -r2 (combase!DISPPARAMS *)(*(void **)(@esp+0x18)) or dx -r1 ((combase!tagVARIANT[3])0x31ec1f0).
Stopping the COM monitor
Run the !comon detach command to stop the COM monitor. This command will remove all the comon breakpoints and debugging session data, but you can still examine COM metadata with the cometa command.
Observing COM interactions outside WinDbg
Sometimes we only need basic information about COM interactions, such as which objects are used and how they are launched. While WinDbg can be overkill for such scenarios, there are several simpler tools we can use to collect this additional information.
Windows Performance Recorder (wpr.exe)
Let’s begin with wpr.exe, a powerful tool that’s likely already installed on your system. WPR requires profile files to configure tracing sessions. For basic COM event collection, you can use the ComTrace.wprp profile from the winget-cli repository. I’ve also created an enhanced profile, adding providers found in the TSS scripts, which you can download here. You can use those profiles either solely or in combination with other profiles, as shown in the examples below.
# Collect only COM events
wpr.exe -start .\WTComTrace.wprp -filemode
# Run COM apps ...
# Stop the trace when done
wpr -stop C:\temp\comtrace.etl

# Collect COM events with CPU sampling
wpr.exe -start CPU -start .\WTComTrace.wprp -filemode
# Run COM apps ...
# Stop the trace when done
wpr -stop C:\temp\comtrace.etl
Some providers are the legacy WPP providers, which require TMF files to read the collected events. Fortunately, the PDB file for compbase.dll contains the required TMF data and we can decode those events. To view the collected data, open the ETL file in Windows Performance Analyzer (WPA). Remember to load symbols first (check the Windows configuration guide how to configure symbols globally in the system), then navigate to the Generic Events category and open the WPP Trace view.
Process Monitor
In Process Monitor, we can include Registry and Process events and events where Path contains \CLSID\ or \AppID strings or ends with .dll, as in the image below:
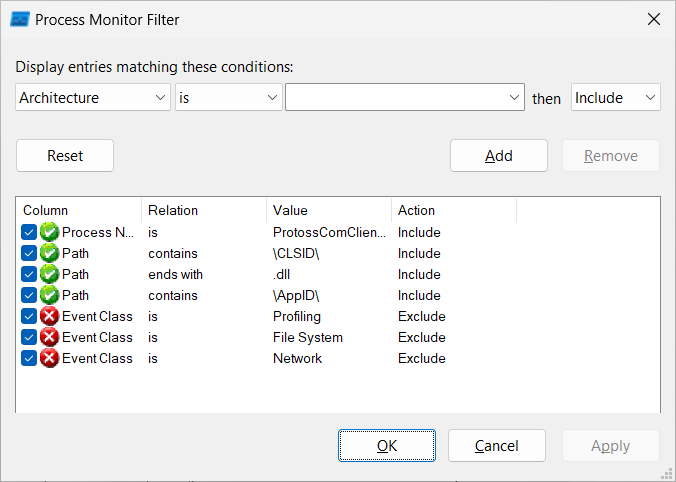
The collected events should tell us which COM objects the application initiated and in which way. For example, if procmon shows a DLL path read from the InprocServer32 and then we see this dll loaded, we may assume that the application created a given COM object (the event call stack may be an additional proof). If the COM server runs in a standalone process or a remote machine, other keys will be queried. We may then check the Process Tree or Network events for more details. COM registry keys official documentation is thorough, so please consult it to learn more.
wtrace
In wtrace, we need to pick the proper handlers and define filters. An example command line might look as follows:
wtrace --handlers registry,process,rpc -f 'path ~ \CLSID\' -f 'path ~ \AppID\' -f 'path ~ rpc' -f 'pname = ProtossComClient'
As you can see, wtrace may additionally show information about RPC (Remote Procedure Call) events.
Troubleshooting .NET COM interop
A native COM object must be wrapped into a Runtime Callable Wrapper (RCW) to be accessible to managed code. RCW binds a managed object (for example, System.__Com) and a native COM class instance. COM Callable Wrappers (CCW) work in the opposite direction - thanks to them, we may expose .NET objects to the COM world. Interestingly, the object interop usage is saved in the object’s SyncBlock. Therefore, it should not come as a surprise that the !syncblk command from the SOS extension presents information about RCWs and CCWs:
0:011> !syncblk
Index SyncBlock MonitorHeld Recursion Owning Thread Info  SyncBlock Owner
-----------------------------
Total           5
CCW             1
RCW             0
ComClassFactory 0
Free            3
When we add the -all parameter, !syncblk will list information about the created SyncBlocks with their corresponding objects, for example:
0:007> !syncblk -all
Index SyncBlock MonitorHeld Recursion Owning Thread Info  SyncBlock Owner
    1 07FF8F54            0         0 00000000     none    030deb48 System.__ComObject
    2 07FF8F20            0         0 00000000     none    030deb3c EventTesting
    3 00000000            0         0 00000000     none           0 Free
    4 00000000            0         0 00000000     none           0 Free
    5 00000000            0         0 00000000     none           0 Free
-----------------------------
Total           5
CCW             1
RCW             0
ComClassFactory 0
Free            3
Now, we can dump information about managed objects using the !dumpobj command, for example:
0:006> !dumpobj 030deb3c
Name:        EventTesting
MethodTable: 08301668
EEClass:     082f7110
CCW:         0833ffe0
Tracked Type: false
Size:        12(0xc) bytes
File:        c:\repos\testing-com-events\bin\NETServer.dll
Fields:
      MT    Field   Offset                 Type VT     Attr    Value Name
0830db50  4000003        4 ...ng+OnEventHandler  0 instance 00000000 onEvent```
The good news is that the !dumpobj command also checks if a given object has a SyncBlock assigned and dumps information from it. In this case, it’s the address of CCW. We may get more details about it by using the !dumpccw command:
0:011> !dumpccw 08060000
Managed object:    02e6cf88
Outer IUnknown:    00000000
Ref count:         0
Flags:
RefCounted Handle: 00D714F8 (WEAK)
COM interface pointers:
      IP       MT Type
08060010 080315b0 Server.Contract.IEventTesting
Notice here that there is only one interface implemented by the managed object and the CCW is no longer in use by the native code (Ref count equals 0). Below is an example of a CCW representing a Windows Forms ActiveX control which is still alive and implements more interfaces:
0:014> !dumpccw 0a23fde0
Managed object:    04ee6984
Outer IUnknown:    00000000
Ref count:         7
Flags:
RefCounted Handle: 04C716D8 (STRONG)
COM interface pointers:
      IP       MT Type
0A23FDF8 09fbbb04 Interop+Ole32+IOleControl
0A23FDC8 09fbbc4c Interop+Ole32+IOleObject
0A23FDCC 09fbbd34 Interop+Ole32+IOleInPlaceObject
0A23FDD0 09fbbde4 Interop+Ole32+IOleInPlaceActiveObject
0A23FDA8 09fbbfa0 Interop+Ole32+IViewObject2
0A23FDB0 09fbc09c Interop+Ole32+IPersistStreamInit
0A23FD4C 09f6485c BullsEyeControlLib.IBullsEye
If you would like to dump information about all objects associated with SyncBlocks, you may use the following WinDbg script:
.foreach /pS 7 /ps 7 (addr { !syncblk -all }) { !do addr }
And to extract only the RCW or CCW addresses, we could use the !grep command from the awesome Andrew Richard’s PDE extension:
0:014> .load PDE.dll
0:014> !grep RCW: .foreach /pS 7 /ps 7 (addr { !syncblk -all }) { !do addr }
RCW:         08086d30
0:014> !grep CCW: .foreach /pS 7 /ps 7 (addr { !syncblk -all }) { !do addr }
CCW:         08060000
To keep COM objects alive in the managed memory, .NET Runtime creates handles for them. Those are either strong or ref-counted handles and we may list them with the !gchandles command, for example:
0:011> !gchandles -type refcounted
  Handle Type          Object     Size     Data Type
00D714F8 RefCounted  02e6cf88       12        0 EventTesting

Statistics:
      MT    Count    TotalSize Class Name
08031668        1           12 EventTesting
Total 1 objects

0:014> !gchandles -type strong
  Handle Type          Object     Size     Data Type
04C711B4 Strong      030deb48       12          System.__ComObject
...

Statistics:
      MT    Count    TotalSize Class Name
04ebbf00        1           12 System.__ComObject
...
Total 19 objects
Of course, in those lists we will find the objects we already saw in the !syncblk output, so it’s just another way to find them. It may be useful when tracking, for example, GC leaks.
Finally, to find who is keeping our managed object alive, we could use the !gcroot command. And it’s quite easy to find the GC roots for a particular type with the following script:
.foreach (addr { !DumpHeap -short -type System.__ComObject }) { !gcroot addr }
Links
- “Essential COM” by Don Box
- “Inside OLE” by Kraig Brockschmidt (Kraig published the whole book with source code on GitHub!)
- “Inside COM+ Base Services” by Guy Eddon and Henry Eddon
- “COM and .NET interoperability” and source code by Andrew Troelsen
- “.NET and COM: The Complete Interoperability Guide” by Adam Nathan
- COM+ revisited by me :)
- Calling Local Windows RPC Servers from .NET by James Forshaw